Change marker size and color

classic Classic list List threaded Threaded
5 messages Options
Reply | Threaded
Open this post in threaded view
|

Change marker size and color

alexr
Hi Mathieu,

I am trying to integrate my program with the RTABMAP and would like to know where can I change the visualization_msgs::Marker::SPHERE etc for the RTABMAP for use on ROS. Can you point to the specific file that defines the marker size and color for the nodes and edges. Also how do you specify the color for different loop closure links and edges. Is it possible to change the default colors for ROS and RTABMAPviz?

Thanks

Alex
------ Alex
Reply | Threaded
Open this post in threaded view
|

Re: Change marker size and color

matlabbe
Administrator
Hi Alex,

can you be more specific on which topics you are referring?

Here are the color options available in RVIZ (rtabmap_ros/MapGraph display) and rtabmapviz (Graph view):


Note that in rtabmapviz, we cannot change the color of the graph in the 3D Map view (which is cyan by default, the color means the Map Id there). We can hide the graph in Preferences->3D Rendering->show graph...

So which graph are you referring?

cheers,
Mathieu
Reply | Threaded
Open this post in threaded view
|

Re: Change marker size and color

alexr
Hi Mathieu,

I am referring to the nodes that rtabmap creates while mapping. I believe its the mapData published topic (RTAB-Map's graph and latest node data). I want to change the radius of the node depicted as blue sphere by default in rtabmap. I am trying to combine semantic features into the node data  and therefore want to know spefically how to change their dimensions (plan is to use it on a small map so the node feature needs to be bigger). Usually in ROS we use the visualization marker array for defining the marker.

In rtabmapviz it can be done but how to do it on the ROS rviz side?

Sorry if my explanation is insufficient.

Thanks
Alex
------ Alex
Reply | Threaded
Open this post in threaded view
|

Re: Change marker size and color

matlabbe
Administrator
Hi Alex,

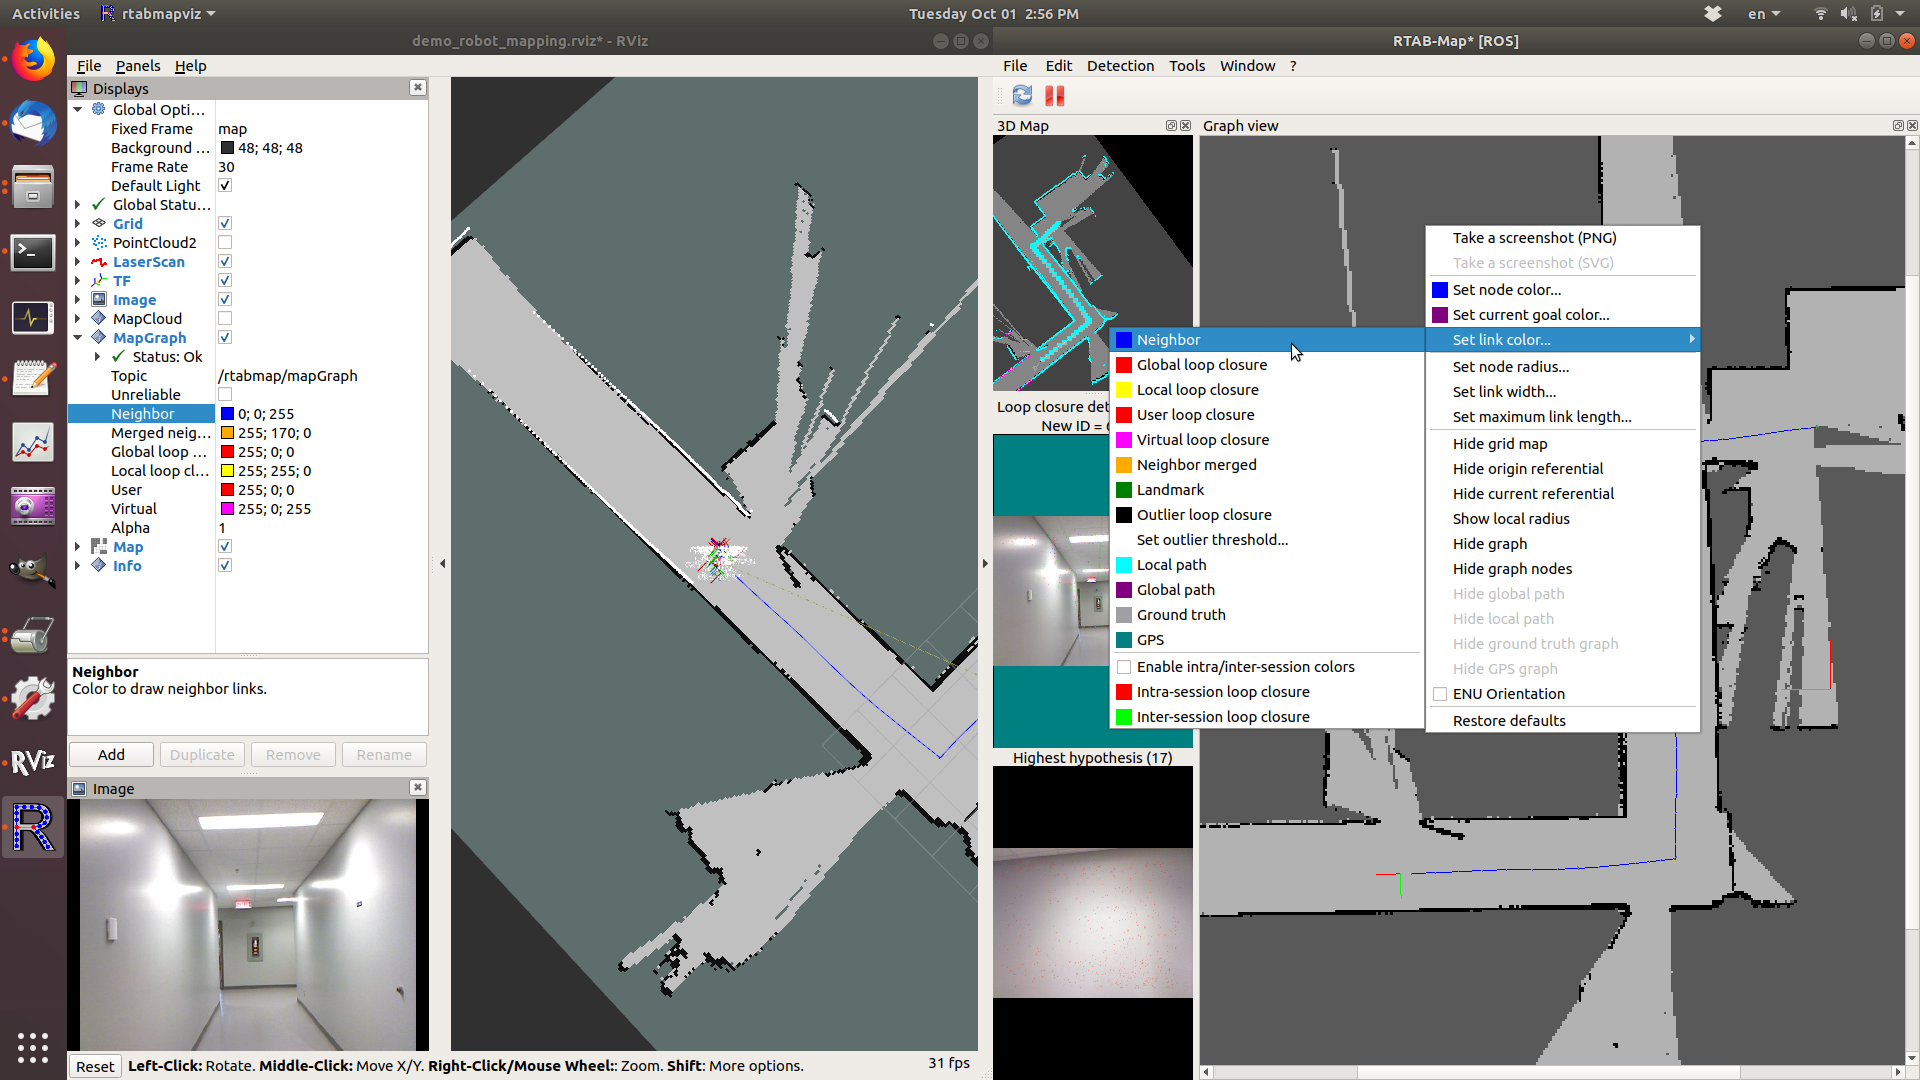
There is no information in the MapData msg about the radius of the nodes. The radius is defined on visualization side by some defautl fixed size. In rtabmapviz, the size of the blue circles in Graph View can be changed on right-click menu, see "Set node radius..." in the screenshot above.

On rviz side, there is no nodes, only links (see MapGraph plugin here). I suggest to make a ROS node, subscribe to MapGraph or MapData topics and republish a Marker or MarkerArray with the data you want to show in rviz.

cheers,
Mathieu
Reply | Threaded
Open this post in threaded view
|

Re: Change marker size and color

alexr
Hi Mathieu,

Thanks for the suggestion. Making a new node and subscribing would be better.

Thanks a lot for your time.

Alex
------ Alex