DataBaseViewer export trajectory

classic Classic list List threaded Threaded
2 messages Options
Reply | Threaded
Open this post in threaded view
|

DataBaseViewer export trajectory

carit0
Hello, we are currently working on our degree project about Visual SLAM and we are working with RTAB-Map.

We are trying to export the trajectory in order to compare It with the real one and we want to plot both trajectories together.
In every file we got multiple columns and we don't understand what means each one.
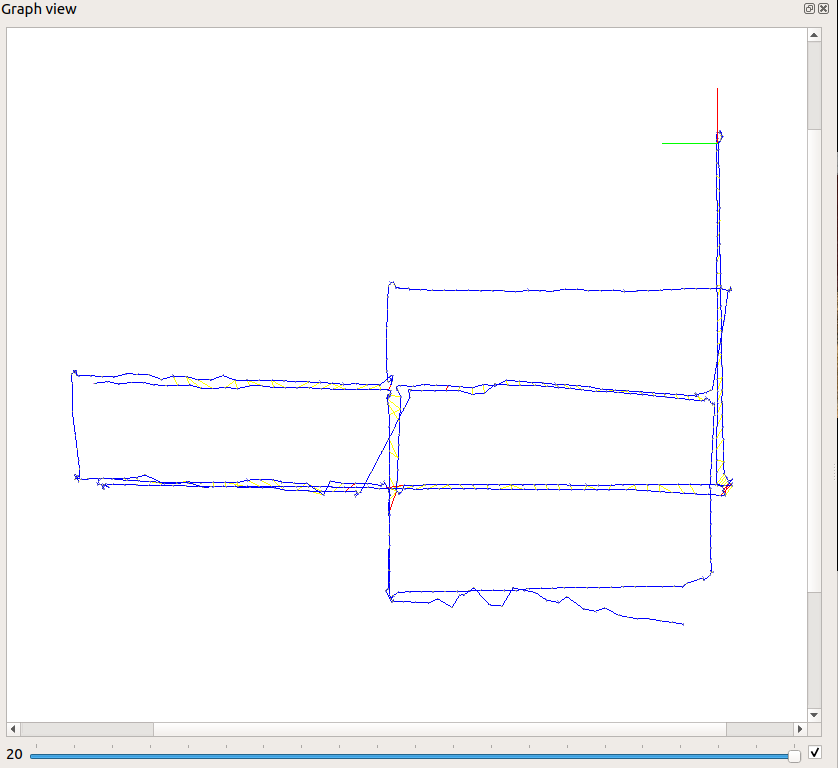

We want to export this exact info pose.

Also could you explain us what the horizontal bar at the bottom of the image means?

Thank you
 
Reply | Threaded
Open this post in threaded view
|

Re: DataBaseViewer export trajectory

matlabbe
Administrator
Hi,

When you do File->Export poses..., you can choose the format you want. refer to corresponding dataset format to know what means each column.

The raw format is a 3x4 transformation matrix (R | t)
r11 r12 r13 tx r21 r22 r23 ty r31 r32 r33 tz

For RGB-D dataset format, it is (3D position + Quaternion):
timestamp x y z qx qy qz qw [id]

The slider under the graph view in rtabmap-databaseViewer can be used to see the graph after X optimization iterations (g2o, gtsam). Zero means raw odometry poses without loop closure constraints. When you do Export Poses, it exports the pose of the iteration chosen.

cheers,
Mathieu