Hi,
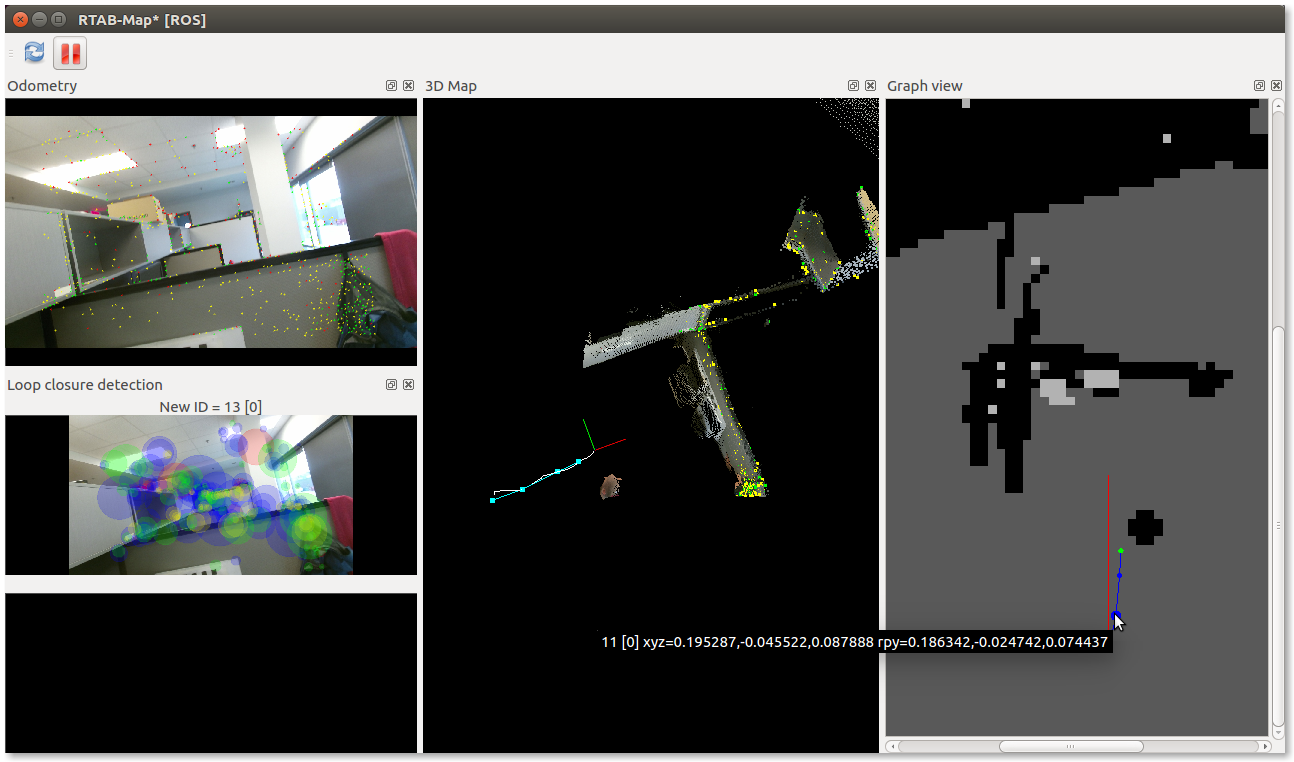
You can open the Graph View (Windows->Show view->Graph view) and mouse over the blue dots:

You can also do File->Export poses to export all the poses (raw format is 3x4 matrix [R O'] where O=[x y z] and R the rotation matrix):
1.000000 0.000216 -0.000027 -0.000038 -0.000216 1.000000 -0.000006 0.000319 0.000027 0.000006 1.000000 0.000212
0.996926 -0.077652 -0.010466 0.195287 0.074346 0.979626 -0.186561 -0.045522 0.024740 0.185209 0.982388 0.087888
0.997031 -0.075059 0.017180 0.427887 0.076998 0.970020 -0.230503 -0.065945 0.000637 0.231142 0.972920 0.171870
0.999861 0.016587 -0.001660 0.567675 -0.016408 0.961728 -0.273515 -0.074285 -0.002940 0.273505 0.961866 0.196490
On ROS, you can show the graph:
$ rostopic echo /rtabmap/mapGraph/poses

-
  position:
    x: -3.82752041332e-05
    y: 0.000318910548231
    z: 0.000211660706555
  orientation:
    x: 3.11282929033e-06
    y: -1.36729213409e-05
    z: -0.00010794717673
    w: 1.0
-
  position:
    x: 0.195287168026
    y: -0.0455224364996
    z: 0.0878878459334
  orientation:
    x: 0.093423159901
    y: -0.00884696812542
    z: 0.0381958274305
    w: 0.994854211921
-
  position:
    x: 0.427887231112
    y: -0.0659453198314
    z: 0.171870052814
  orientation:
    x: 0.116287108322
    y: 0.00416723027968
    z: 0.0383026763441
    w: 0.992468058351
-
  position:
    x: 0.567674875259
    y: -0.0742847025394
    z: 0.196489796042
  orientation:
    x: 0.13808263357
    y: 0.000323201520313
    z: -0.00832889561823
    w: 0.990385634628
cheers,
Mathieu