Ouster drive under the rain
|
Administrator
|
This post was updated on .
Just saw this post about a car with an os1-64 lidar driving under the rain in San Francisco. They provide the rosbag of the ouster: rain_drive.bag. I've thought it would be nice to see rtabmap running on this public rosbag. I updated rtabmap.launch to easily use the rosbag without modifications. Then based on the KITTI parameters of this paper and making sure that rtabmap is built with libpointmatcher support, we can do:
roslaunch rtabmap_ros rtabmap.launch    \
   use_sim_time:=true \
   depth:=false \
   subscribe_scan_cloud:=true \
   frame_id:=os1_sensor \
   scan_cloud_topic:=/os1_cloud_node/points \
   scan_cloud_max_points:=131072  \
   icp_odometry:=true \
   approx_sync:=false \
   args:="-d  \
      --RGBD/CreateOccupancyGrid false \
      --Rtabmap/DetectionRate 2 \
      --Odom/ScanKeyFrameThr 0.8 \
      --OdomF2M/ScanMaxSize 10000  \
      --OdomF2M/ScanSubtractRadius 0.5   \
      --Icp/PM true \
      --Icp/VoxelSize 0.5   \
      --Icp/MaxTranslation 2   \
      --Icp/MaxCorrespondenceDistance 1.5 \
      --Icp/PMOutlierRatio 0.7 \
      --Icp/Iterations 10 \
      --Icp/PointToPlane false \
      --Icp/PMMatcherKnn 3 \
      --Icp/PMMatcherEpsilon 1 \
      --Icp/Epsilon 0.0001 \
      --Icp/PointToPlaneK 0 \
      --Icp/PointToPlaneRadius 0 \
      --Icp/CorrespondenceRatio 0.01"

$ rosbag play --clock --pause rain_drive.bag
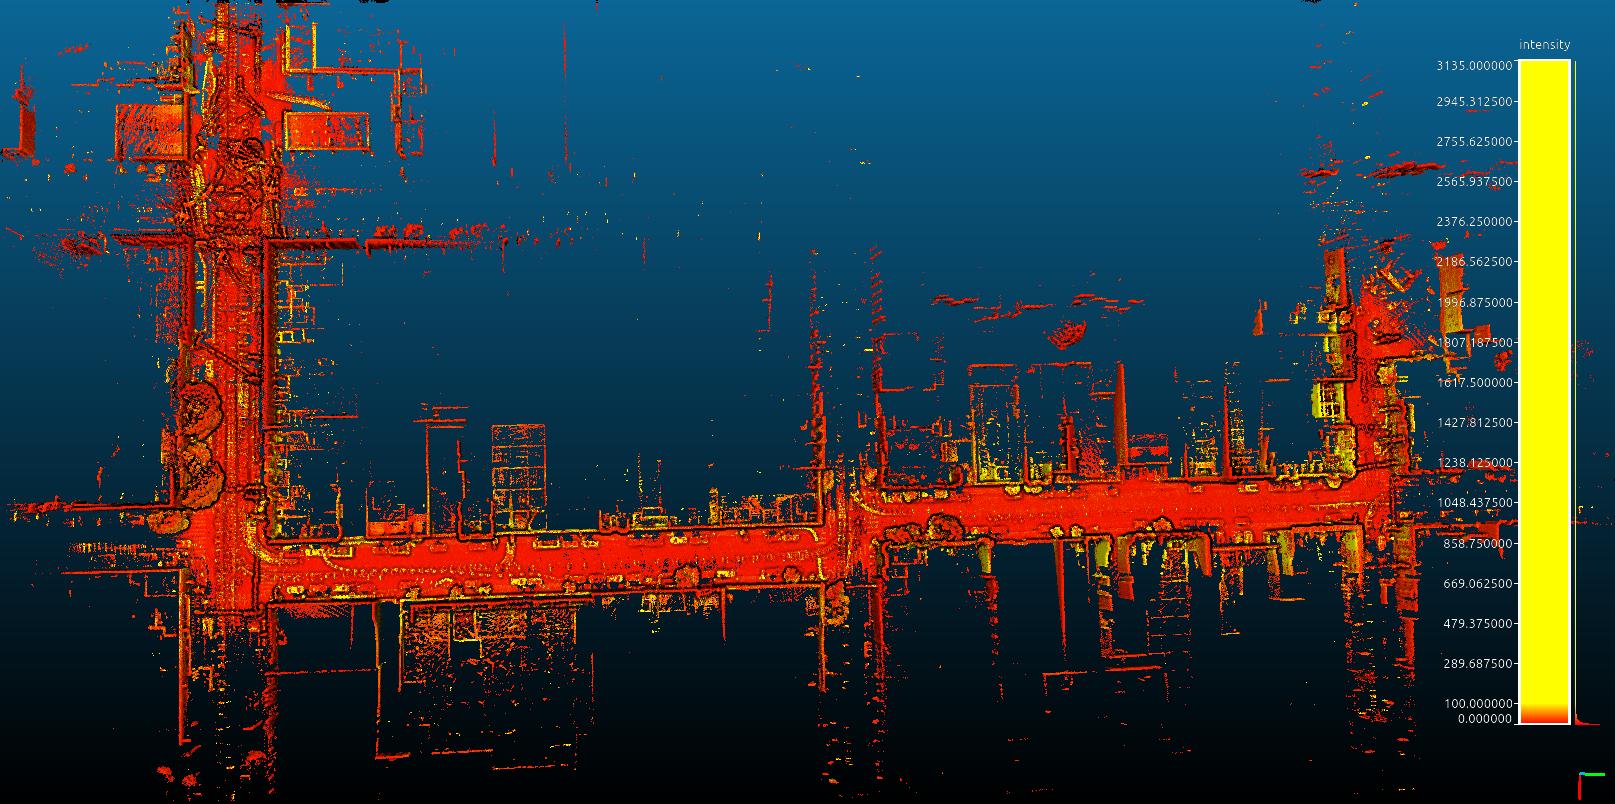
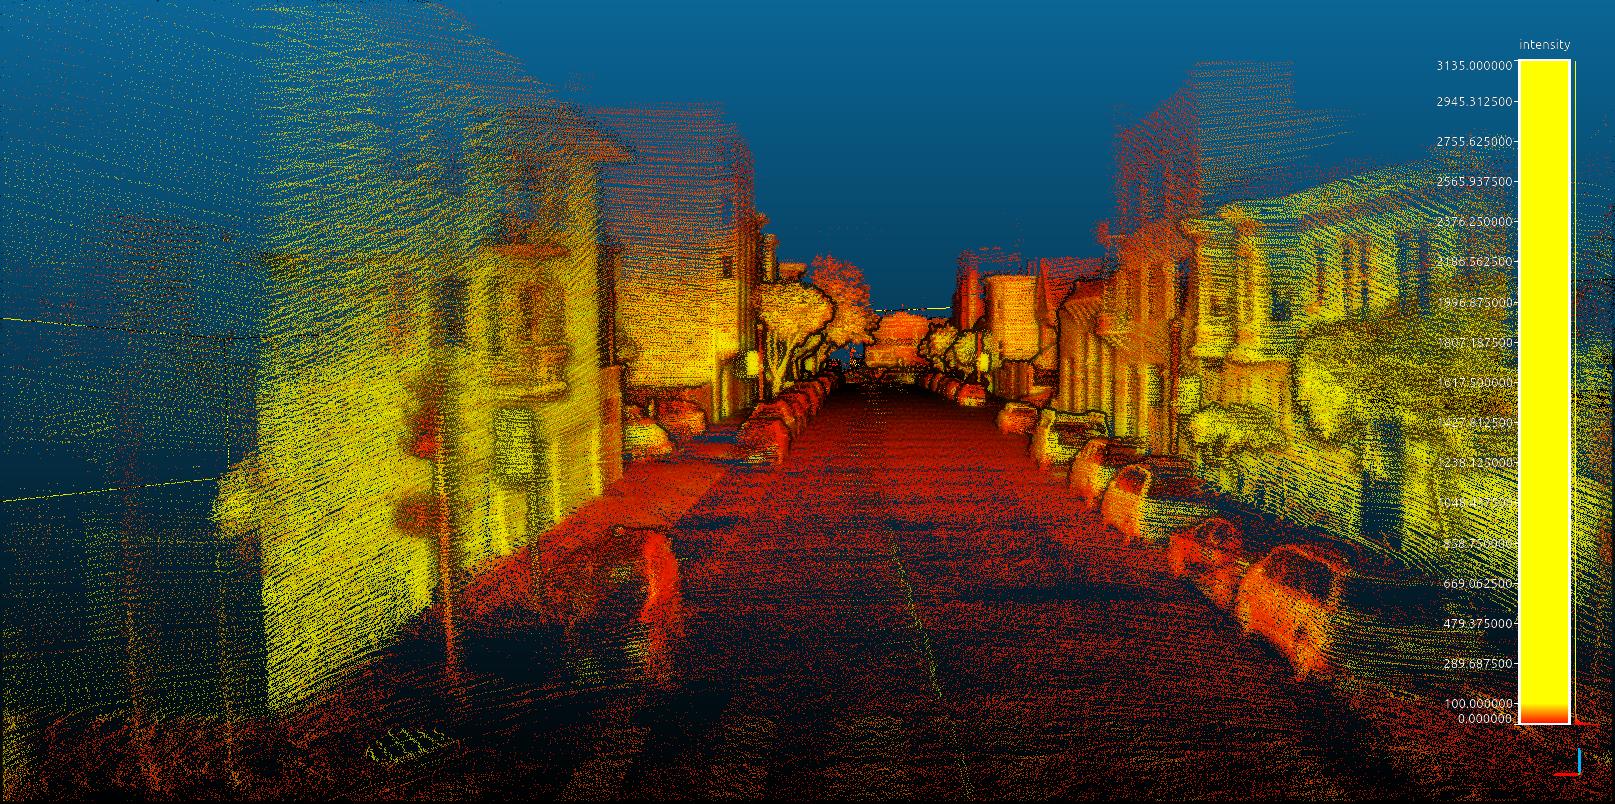
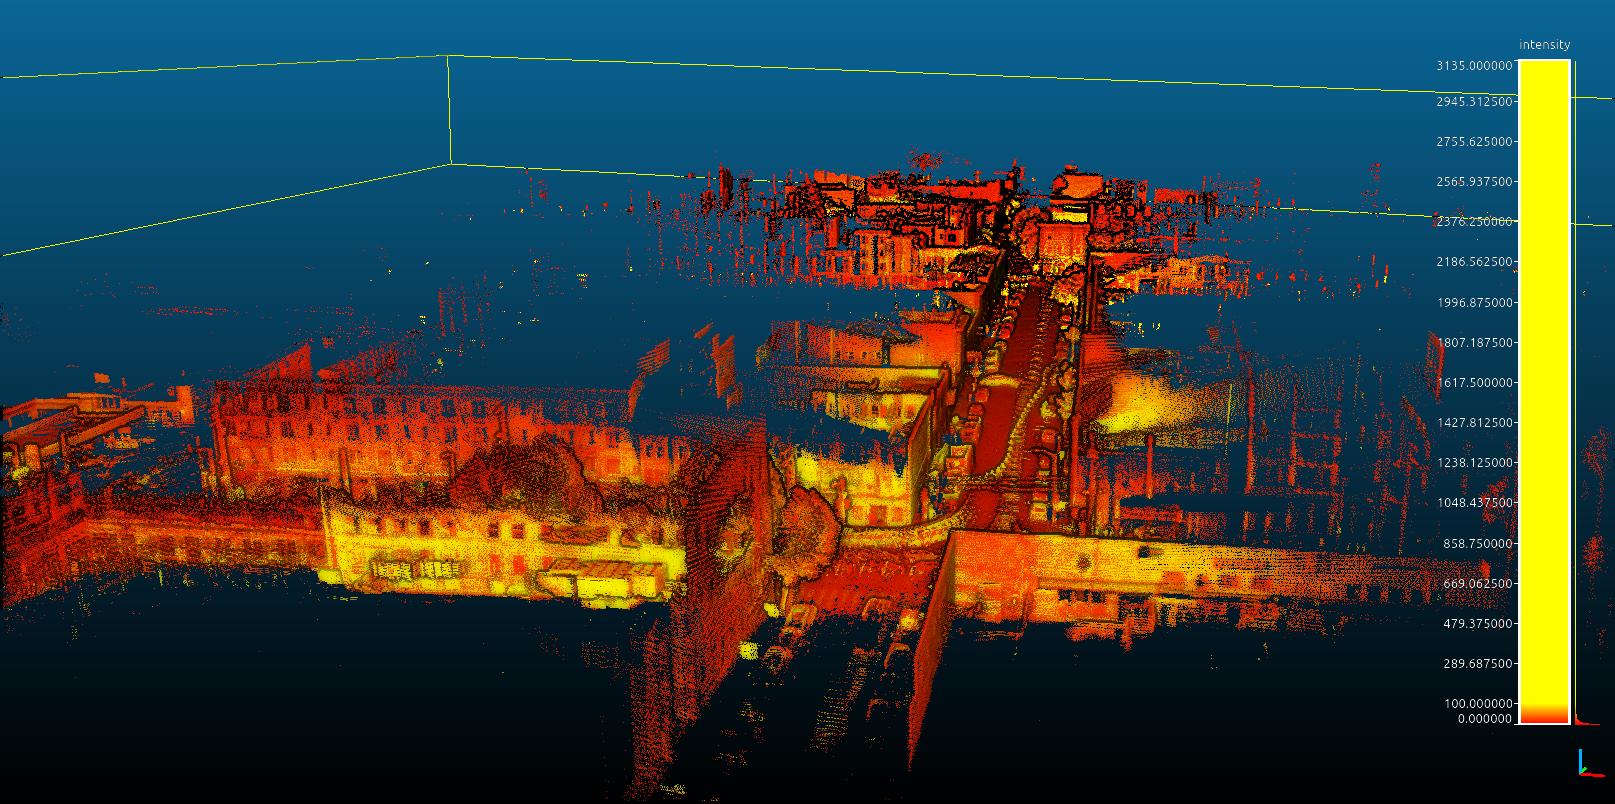
Before unpausing the bag, in rtabmapviz (just for rendering performance), go in Preferences->3D Rendering and set voxel size of 0.5 meters under Map and Odom columns under Laser scan section. in the main window, we can hit keys 1 to 6 to change color of the scan, by default it will use intensity in as gray scale. With latest rtabmap library version, we can right-click on the 3D View, under Scan menu, set maximum intensity to ~400 to better see the contrast of intensity. After the mapping, we can export in high resolution the resulting clouds (File->Export 3D clouds...). Uncheck the first checkbox to assemble the scans and click on Regenerate clouds. There are some screenshots taken with CloudCompare in EDL shading mode:    EDIT: Loop closure detection Note that in this mode (only lidar), rtabmap won't do visual loop closure detection, so only small loops could be closed with proximity detection. For large scale mapping, we would need to add a stereo camera to this setup or use the ambient ouster images for loop closure detection (though we cannot do this right know as rtabmap is assuming pinhole camera models, not cylindric images). EDIT 2 Updated parameters above to match exactly those in this KITTI evaluation script (S2M - PointToPoint, Table 3 in this paper). Note that if you update rtabmap and rtabmap_ros to latest version (this commit), we can now add odom_args:="--Icp/DownsamplingStep 4" with ouster point clouds for a performance boost. On my laptop (XPS2019), I can get an average of 40 ms of computation time for odometry (instead of 49 ms), so mostly all ouster frames at 20 Hz can be processed online. cheers, Mathieu |
|
Hi,
This is interesting, how to integrate stereo data into this setup. I have a zed camera and same lidar. Defining tf for the setup would be essential I guess. Can this work with just left and right images coming from the zed since the lidar has the IMU built in. I can try to provide a small bag file with this setup if you want for testing. Thanks
------
Alex
|
|
Administrator
|
This post was updated on .
Hi,
In the rain_drive.bag, they didn't record the imu, so the example is pure lidar, unlike this other ouster example with imu. TF is essential to know where is the camera accordingly to lidar (or vice-versa). We would need left and right images from ZED with their corresponding camera_info. The point cloud topic and imu topic (optional) from ouster with tf and tf_static topics. Note that the rain_drive.bag above has timestamp issues if you want to synchronize the data with other sensors. The timestamps are starting at 0, instead of computer time. Computer time is required to synchronize with the camera topics. Look at this patch to set host timestamps for ouster topics (not sure if the inverted gravity issue is still there on latest ouster firmware, the ouster imu data should show a positive +9.8 acceleration on z-axis when upside up). cheers, Mathieu |
«
Return to Official RTAB-Map Forum
|
1 view|%1 views
| Free forum by Nabble | Edit this page |

