RTABMap graph

classic Classic list List threaded Threaded
2 messages Options
Reply | Threaded
Open this post in threaded view
|

RTABMap graph

matteo.scucchia
Hi,
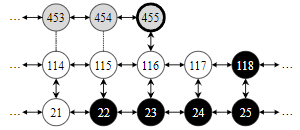
is there any way to display the graph as shown in the paper "Appearance-Based Loop Closure Detection for Online Large-Scale and Long-Term Operation" with node's ID and edges between nodes (an image is reported below)?


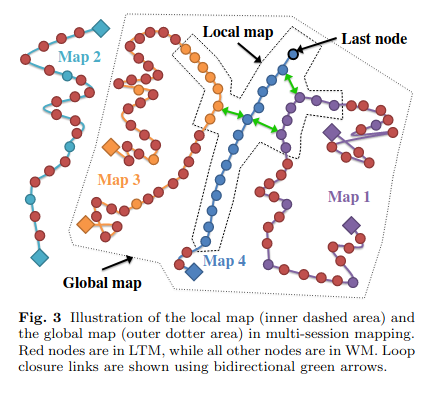
With respect to the graph, how RTABMap optimize the graph when a loop closure is detected? It optimizes a global map or a local map?
In case of global map, how can it optimize nodes that are in LTM? In case of local map, nodes in LTM are not optimized?

Last question about the graph of RTABMap, is it possible to have in WM nodes that are not directly connected each other? In this case how RTABMap correct the graph in case of loop closure?

Thanks a lot for the attention.

Best regards,
Matteo
Reply | Threaded
Open this post in threaded view
|

Re: RTABMap graph

matlabbe
Administrator
Hi,

This figure has been created manually as an example. When you open the database in rtabmap-databaseViewer and open Graph View, you will see the global graph (mouse over the nodes to know their ID). You can also see a "WM" checkbox under Graph View, when clicked, it should show nodes in color (blue/red depending if they are in WM or LTM).

On loop closure, rtabmap only optimizes the local graph. Poses from LTM will be optimized only when we retrieve to node back in WM.

It is possible to have nodes in WM hat are not in the local optimized graph. This is better illustrated in that paper "Long-Term Online Multi-Session Graph-Based SPLAM with Memory Management":


cheers,
Mathieu