Hi,
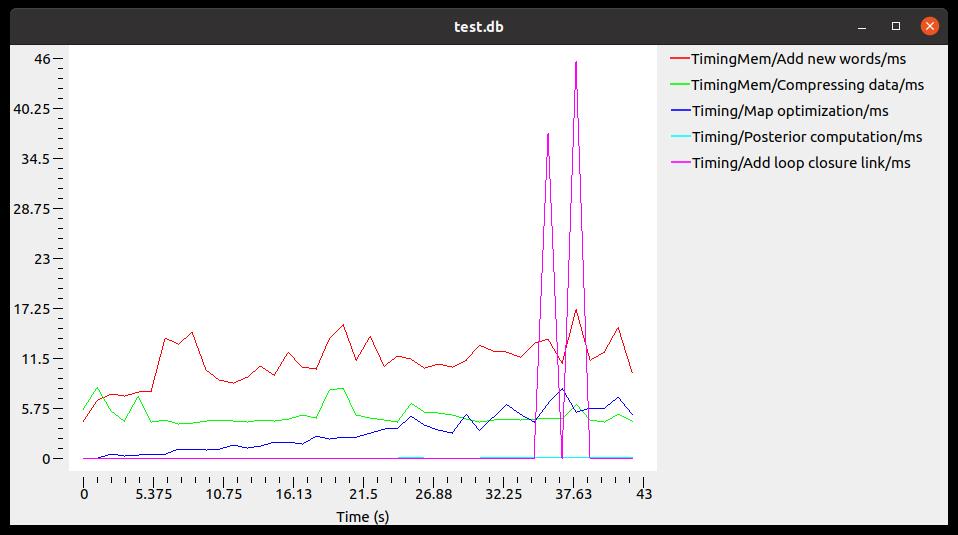
One way to check which part is taking the most time is by looking at the statistics saved in the database. They can be shown in rtabmap-databaseViewer under Statistics panel.
From command line, it is also possible to do so. To show available statistics in the database:
rtabmap-report --stats rtabmap.db
Then to show main steps:
rtabmap-report TimingMem/Add_new_words/ms TimingMem/Compressing_data/ms Timing/Map_optimization/ms Timing/Posterior_computation/ms Timing/Add_loop_closure_link/ms rtabmap.db

cheers,
Mathieu