White dotted line graph view

classic Classic list List threaded Threaded
6 messages Options
Reply | Threaded
Open this post in threaded view
|

White dotted line graph view

Nico
Hello,

I will need again your assistance :)
I followed what you said and now I start to have good maps, and understand better the parameters I need to change to get the results I want.

However, when I do a mapping session and look at the graph, I got plenty of white dotted line :

I work with a 3 Hz frequency, and a cell resolution of 5 cm / pix

I don't understand them.
What do they mean ?
Can I put them away ?

Thank you for your help.

Nicolas
Reply | Threaded
Open this post in threaded view
|

Re: White dotted line graph view

matlabbe
Administrator
Hi,

What is the camera position on the robot? Do you have a screenshot? Do you have a small rtabmap database to share?

The camera may be high over the ground or it is seeing the ceiling, so not much points could be projected to ground.

cheers
Reply | Threaded
Open this post in threaded view
|

Re: White dotted line graph view

Nico
This post was updated on .
Hi,

Unfortunately, I don't have a database available yet, as my SLAMdunk (I am still working with the slamdunk from parrot) started not to work since Friday evening (and I deleted my former one when I wanted to do a new mapping...).
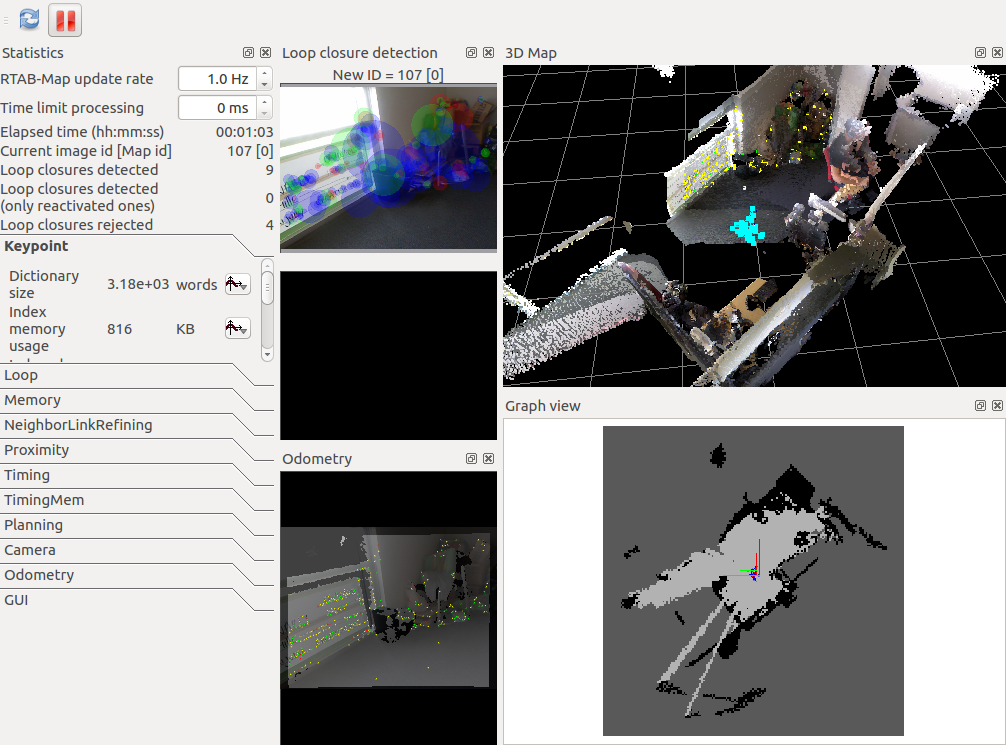
However I have a screenshot from a former mapping (where you can't see the white dotted lines).


 As it is working on the drone, the camera is maybe ~1.10m above ground.
Do you think the lines are caused by the fact that the camera is seeing the floor/ceiling ?
Does the camera need to see the ground ?

If yes, it may explain why I have somethimes the white lines and the black lines across a corridor ?

Thank you.  

Edit : I found in your papers the algorithm :)
PS : do you have a webpage where the algorithm is explained ? I mean, not the tutorials where you explain how to make RTABmap work, but a bit like what you did on this : http://wiki.ros.org/rtabmap_ros/Tutorials/SetupOnYourRobot
but with the program (for example rtabmap is launched, then it subscibes to the appropriate topics, then the image are analysed for the inliers etc...).

I am studying all the cpp files but as they are numerous it takes some time :)
Reply | Threaded
Open this post in threaded view
|

Re: White dotted line graph view

matlabbe
Administrator
This post was updated on .
Hi,

Which rtabmap version do you have? For your setup, you may want to get latest rtabmap code from master branch. There is a new parameter called "Grid/ProjRayTracing" (default true) that will automatically fill empty space in your map without having the camera seeing the ground.

Example:
$ roslaunch freenect_launch freenect.launch depth_registration:=true
$ roslaunch rtabmap_ros rtabmap.launch args:="-d --Odom/AlignWithGround true"


For a description of rtabmap's SLAM back-end, see Online Global Loop Closure Detection for Large-Scale Multi-Session Graph-Based SLAM 
or for loop closure detection: Appearance-Based Loop Closure Detection for Online Large-Scale and Long-Term Operation.

See this post: http://official-rtab-map-forum.206.s1.nabble.com/Threads-in-RTAB-Map-td790.html for a list of threads running in parallel as well as a link to Rtabmap::process() method (which is the main loop of rtabmap back-end). On ROS side, see CoreWrapper.cpp (rtabmap node), which is a wrapper of the Rtabmap class to feed it topics coming from ROS.

You can also see this simple c++ example with processing in sequence: https://github.com/introlab/rtabmap/blob/master/examples/NoEventsExample/main.cpp

cheers,
Mathieu
Reply | Threaded
Open this post in threaded view
|

Re: White dotted line graph view

Nico
Hello,

Sorry for the late answer.
I am using the 0.12.5 version and I have the parameter Grid/ProjRayTracing.

However, modifiying the value if the parameter does not change anything.
The map is still filled with -1 when the ground is not seen, and I want to have 0 as I have with the Turtlebot on Gazebo.

The main difference I see is that I don't have any laser with my slamdunk, just an ultrasound, but I have seen that the ultrasound can't be used with RTABMap.

Do you know if I can modify this, in order to get the 0 value for an unknown space ?
I think -1 will be embarrassing for the path planning, and having a gray and white floor is quite annoying...

Thank you for your help.

I read the documents and they are very intersting. The work you've done is very impressive !
Reply | Threaded
Open this post in threaded view
|

Re: White dotted line graph view

matlabbe
Administrator

Hi,

As stated in the parameter description, "Grid/3D" should be false so that ray tracing is done. You can try setting to false to see if something changes.

cheers,
Mathieu