Landmark usage
Posted by ferrangg on
URL: http://official-rtab-map-forum.206.s1.nabble.com/Landmark-usage-tp9045.html
Hi,
I have enabled the marker detection (Aruco Markers) and I have faced some strange situations:
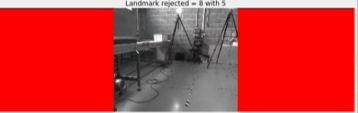
(1) Sometimes I see in rtabmap-viz "landmark rejected". What does it mean? I know that for LC it means theat the highest hypothesis was rejected because a transformation could not be found (with enough inliers), but I don't know in case of landmarks how it works.
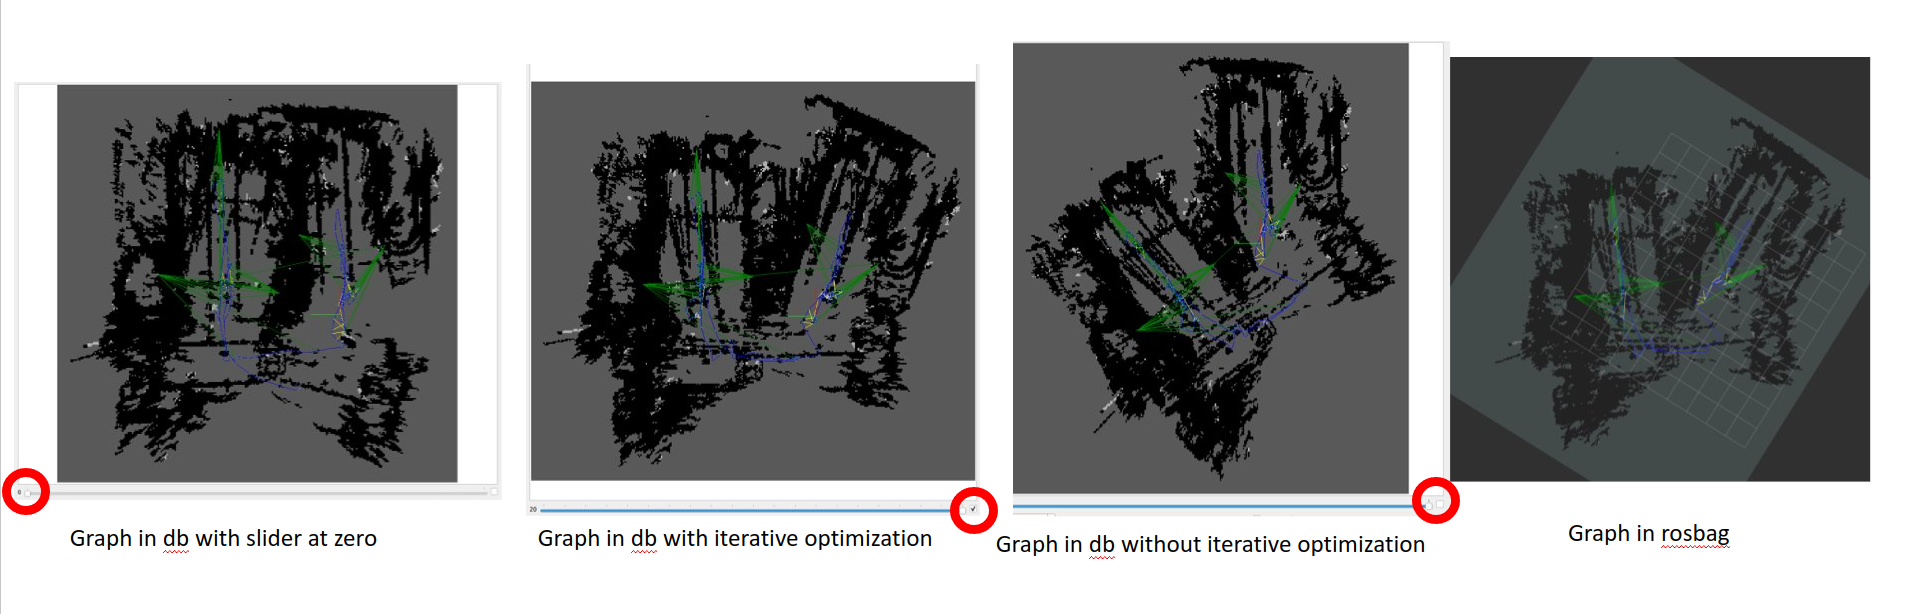
(2) I have "discovered" that the graph published in ROS, is equal to the one visualized in rtabmap.db when "Iterative optimization" box is disabled. Normally the graph with and without "Iterative optimization" box enabled looks almost the same, but when I use markers there is really a difference. I also tried to move the slider to zero, and the graph looked even better. Can you explain a little bit what this "iterative optimization" is? I thought that the slider could be equal to the Optimizer/Iterations parameter, which is by default 20 (at least when using GTSAM, which is my case), so I would expect that online rtabmap (also when using ROS) performs those iterations when optimizing. However, as I see that what is in the database is not equal to what is in ROS, I feel I am still missing something.
(3) I have realized that the resulting graph is worse than without landmarks. I have tried to set higher variances for the markers (specially for orientation) and also enable robust optimization with Vertigo, and then I get similar results than without markers, when I would expect a significant improve. Have you experienced significant improve when using markers?
Thank you in advance,
Ferran
URL: http://official-rtab-map-forum.206.s1.nabble.com/Landmark-usage-tp9045.html
Hi,
I have enabled the marker detection (Aruco Markers) and I have faced some strange situations:
(1) Sometimes I see in rtabmap-viz "landmark rejected". What does it mean? I know that for LC it means theat the highest hypothesis was rejected because a transformation could not be found (with enough inliers), but I don't know in case of landmarks how it works.
(2) I have "discovered" that the graph published in ROS, is equal to the one visualized in rtabmap.db when "Iterative optimization" box is disabled. Normally the graph with and without "Iterative optimization" box enabled looks almost the same, but when I use markers there is really a difference. I also tried to move the slider to zero, and the graph looked even better. Can you explain a little bit what this "iterative optimization" is? I thought that the slider could be equal to the Optimizer/Iterations parameter, which is by default 20 (at least when using GTSAM, which is my case), so I would expect that online rtabmap (also when using ROS) performs those iterations when optimizing. However, as I see that what is in the database is not equal to what is in ROS, I feel I am still missing something.
(3) I have realized that the resulting graph is worse than without landmarks. I have tried to set higher variances for the markers (specially for orientation) and also enable robust optimization with Vertigo, and then I get similar results than without markers, when I would expect a significant improve. Have you experienced significant improve when using markers?
Thank you in advance,
Ferran
| Free forum by Nabble | Edit this page |