Differences between ROS output vs. desktop
Posted by UnderwaterCook on
URL: http://official-rtab-map-forum.206.s1.nabble.com/Differences-between-ROS-output-vs-desktop-tp9333.html
Hello,
Thank you very much for all the excellent work with RTAB-Map.
I have been working for some time to achieve an optimal point cloud map using a robot equipped with a Kinect for Azure depth cam. I am doing localization against it, but also running some object segmentation so I need some really clean clouds. Thanks to some of the posts in this forum I'm able to generate a pretty nice map in the RTAB desktop application, but I am getting different subpar results when I run the same recording through the ROS node, referencing the same config file. I’m running the same rtabmap binary built within the ROS workspace.
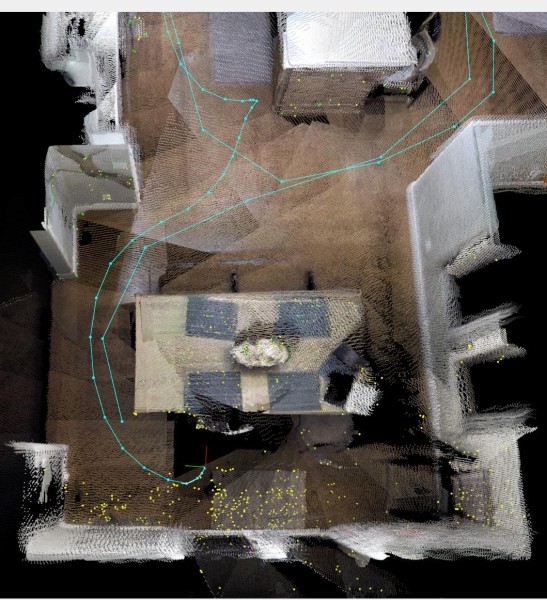
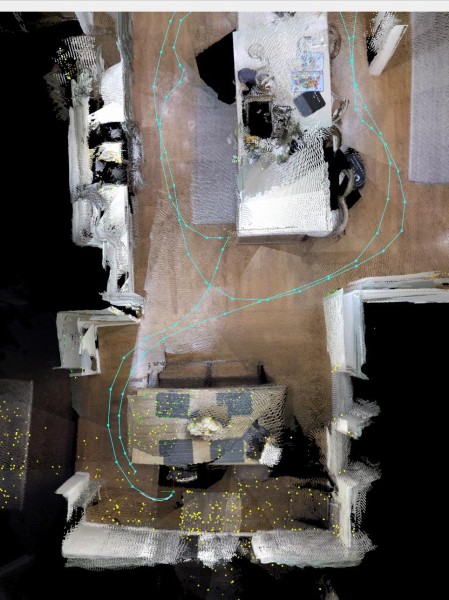
The ROS-generated point cloud has several large offsets between the walls as the run loops around the same areas.
Desktop:
ROS:
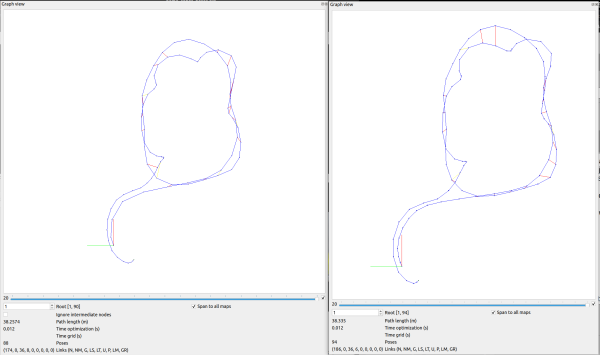
The two maps seem to be doing roughly the same number of loop closures, but in different places. Here is a side-by-side of the two graph views:
Do you have any ideas where the discrepancies might be between the two setups?
- Desktop database
- ROS-generated database
- ROS launch file
- Original MKV file
Playback via ROS driver:
ros2 run azure_kinect_ros2_driver azure_kinect_node --ros-args -p recording_file:=kitchen_loop19_tilt30_720p_30fps_wfov.mkv
And to get mkv playback working in the RTAB desktop app I had to apply this patch.
Thank you for your help!
URL: http://official-rtab-map-forum.206.s1.nabble.com/Differences-between-ROS-output-vs-desktop-tp9333.html
Hello,
Thank you very much for all the excellent work with RTAB-Map.
I have been working for some time to achieve an optimal point cloud map using a robot equipped with a Kinect for Azure depth cam. I am doing localization against it, but also running some object segmentation so I need some really clean clouds. Thanks to some of the posts in this forum I'm able to generate a pretty nice map in the RTAB desktop application, but I am getting different subpar results when I run the same recording through the ROS node, referencing the same config file. I’m running the same rtabmap binary built within the ROS workspace.
The ROS-generated point cloud has several large offsets between the walls as the run loops around the same areas.
Desktop:
ROS:
The two maps seem to be doing roughly the same number of loop closures, but in different places. Here is a side-by-side of the two graph views:
Do you have any ideas where the discrepancies might be between the two setups?
- Desktop database
- ROS-generated database
- ROS launch file
- Original MKV file
Playback via ROS driver:
ros2 run azure_kinect_ros2_driver azure_kinect_node --ros-args -p recording_file:=kitchen_loop19_tilt30_720p_30fps_wfov.mkv
And to get mkv playback working in the RTAB desktop app I had to apply this patch.
Thank you for your help!
| Free forum by Nabble | Edit this page |