Trajectory Generation

classic Classic list List threaded Threaded
15 messages Options
Reply | Threaded
Open this post in threaded view
|

Trajectory Generation

André
Hi,

how can I generate the trajectory made when mapping and visualize it in the 3D and 2D map?

Like this image below.


Thanks =)
Reply | Threaded
Open this post in threaded view
|

Re: Trajectory Generation

James
I also had this same problem in generatig these figures.

So... How can we record the database and configure the rtab-databaseviewer to show this kind of figure?
Reply | Threaded
Open this post in threaded view
|

Re: Trajectory Generation

James
Actually, I am having trouble in generating the trajectory in Graph View with these grey walls you did. Mine just keeps with a white background.

The second issue is that when I try to save a picture of the Graph, it allways saves something like a pixel rather then the hole path performed.

Finally, I cannot see the 3D map with the odometry (trajectory performed) as well.

I beleieve it is a matter of settings in data recording, no?
Reply | Threaded
Open this post in threaded view
|

Re: Trajectory Generation

matlabbe
Administrator

The trajectory should be shown by default (see the parameter "Show graphs"). For example, if you download the database 5MappingSessions_OnlineConstraint700ms.db from the Multi-session tutorial, you should have something like the screenshots below.

  1. Execute "rtabmap"
  2. File -> Open database...
  3. Make sure that 3D Map and Graph view panels are shown before the next step (see Window -> Show view)
  4. Edit -> Download all clouds (update cache)

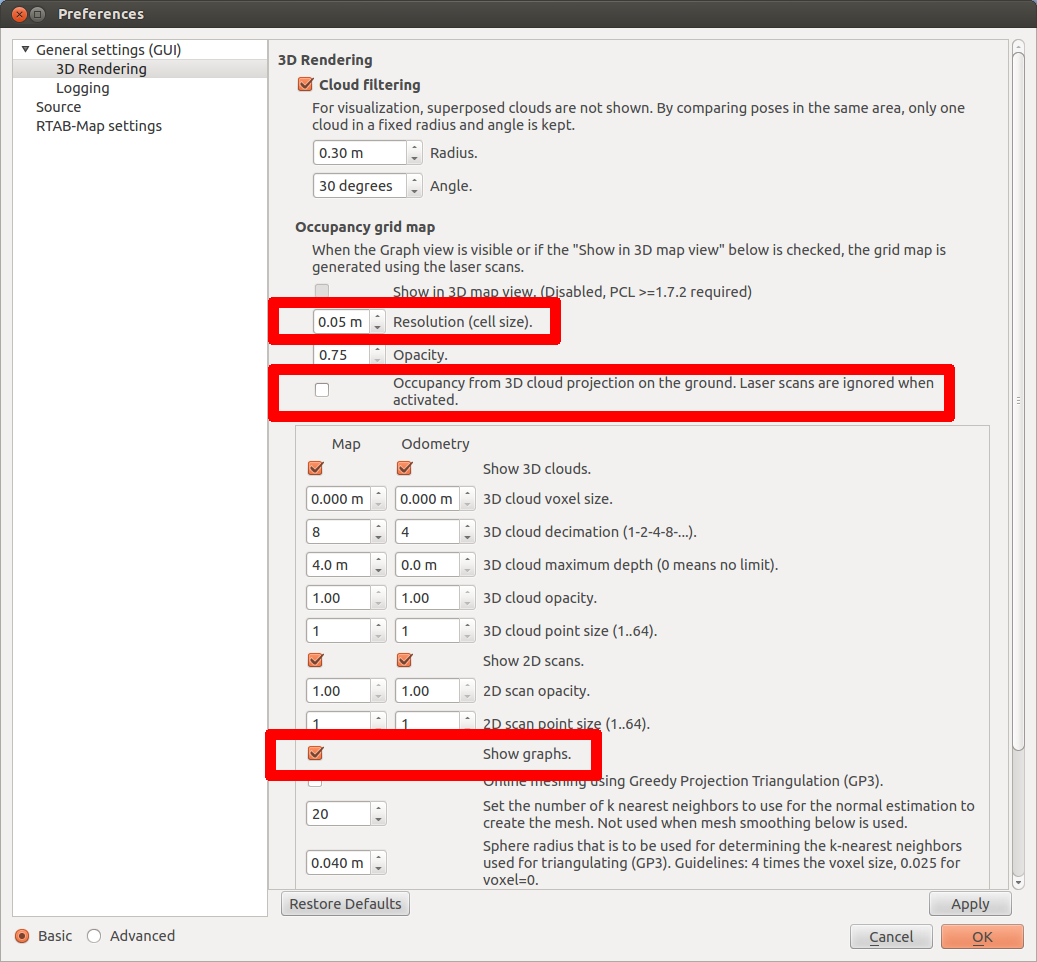
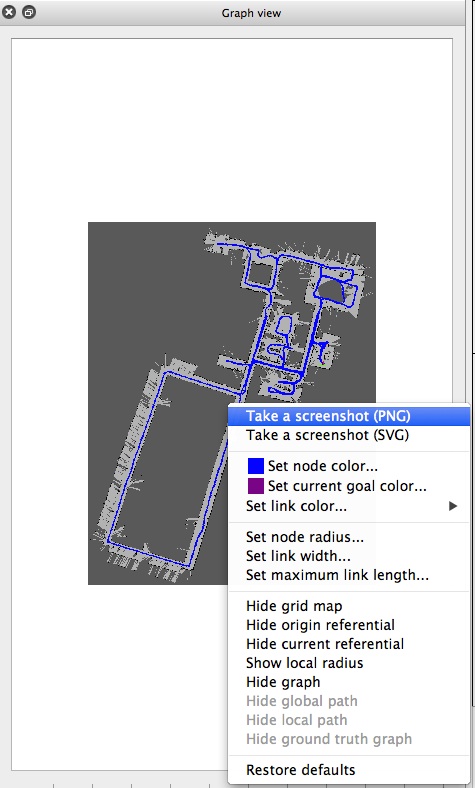
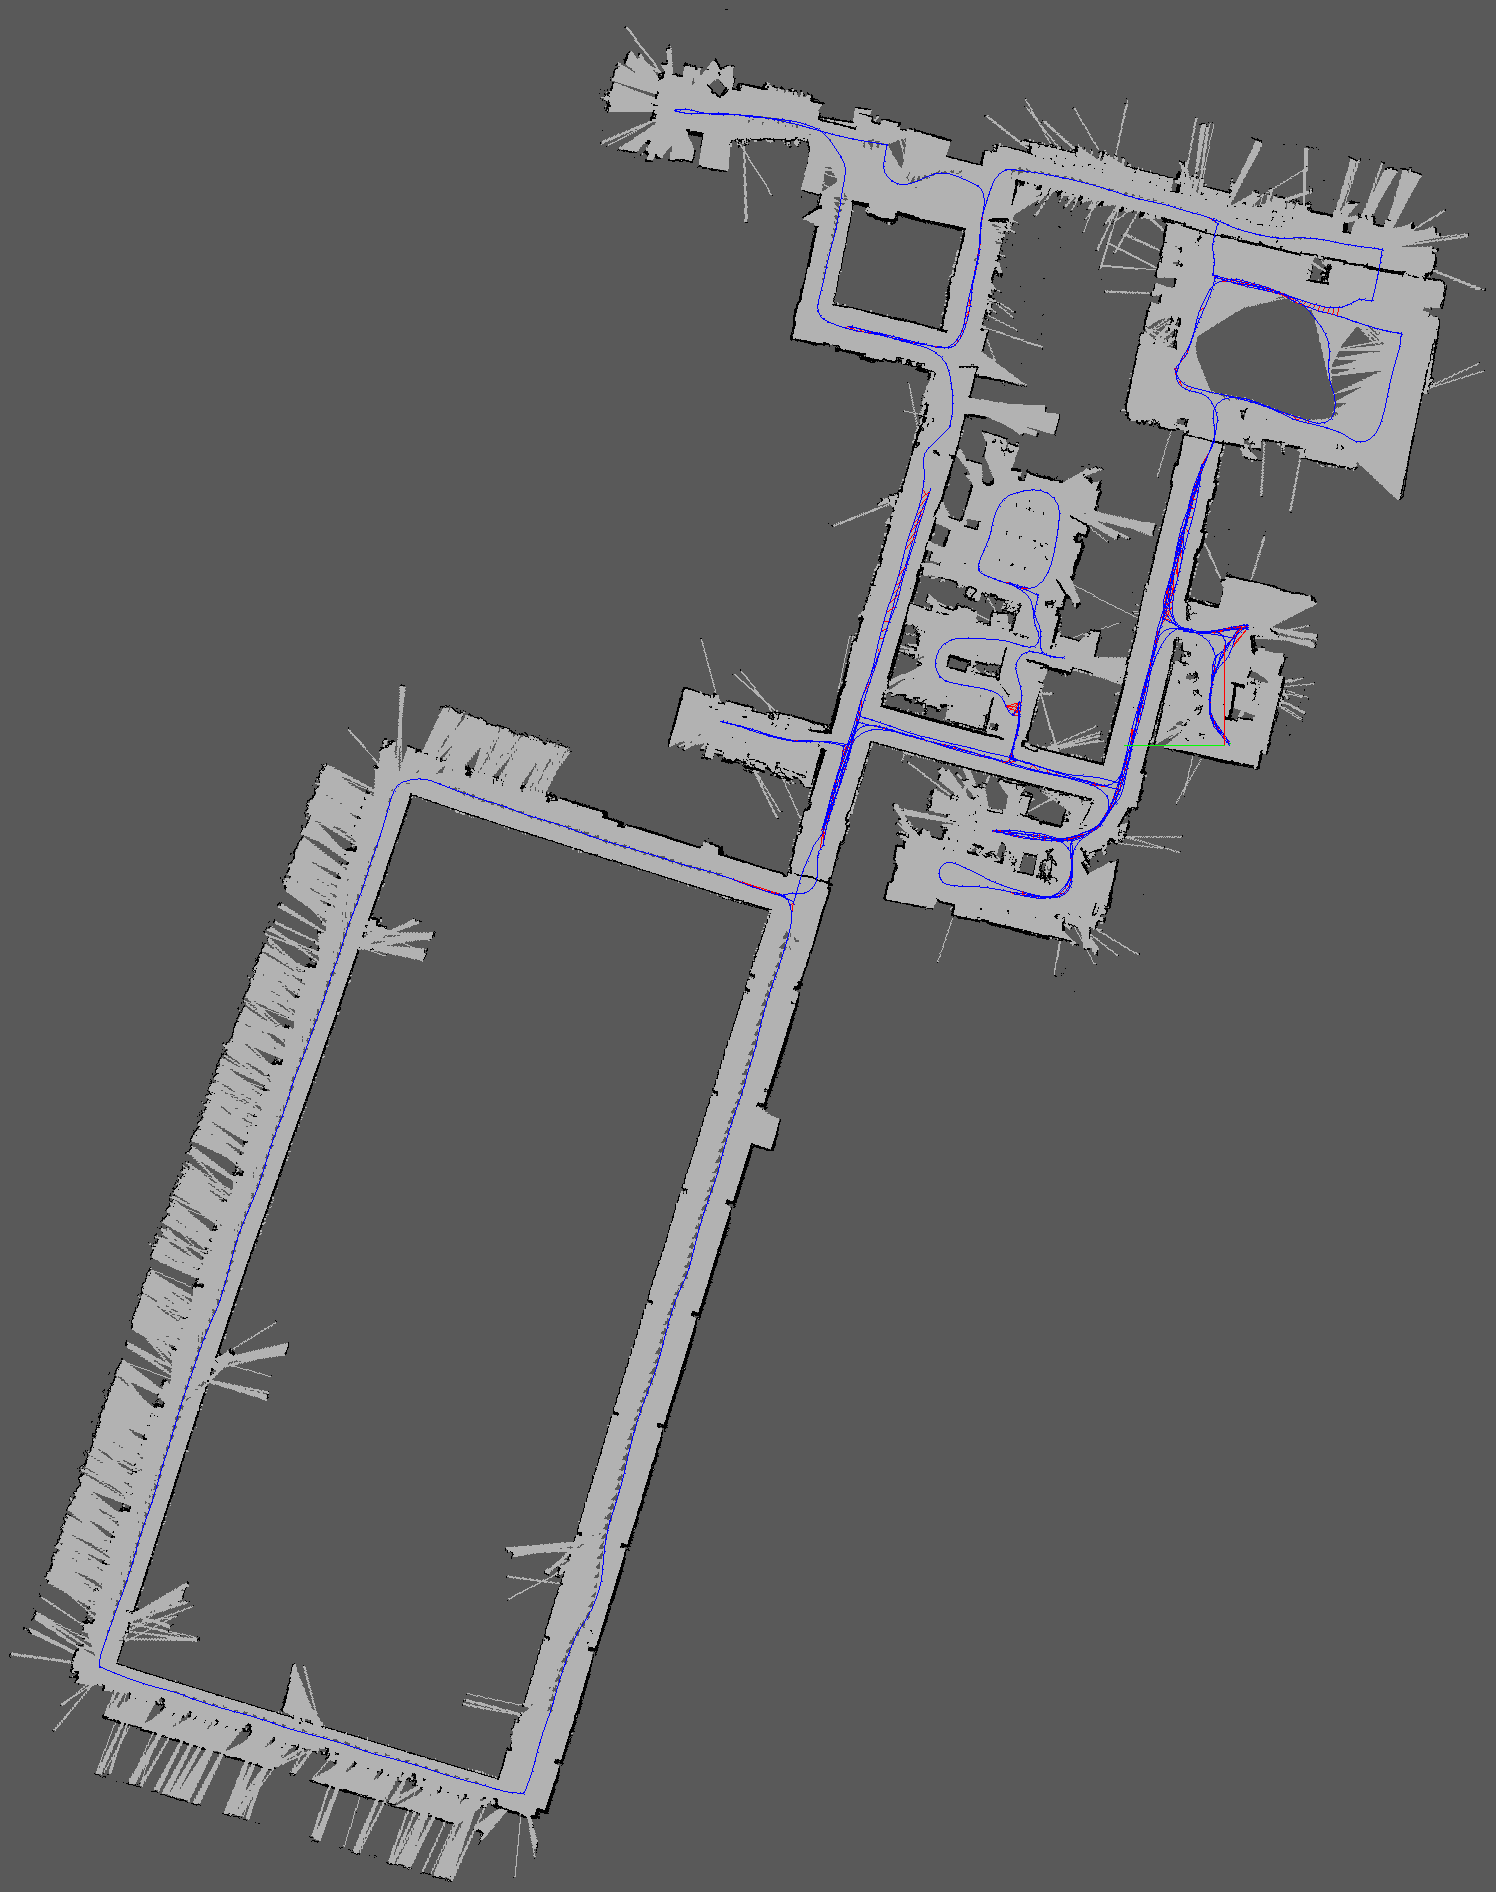
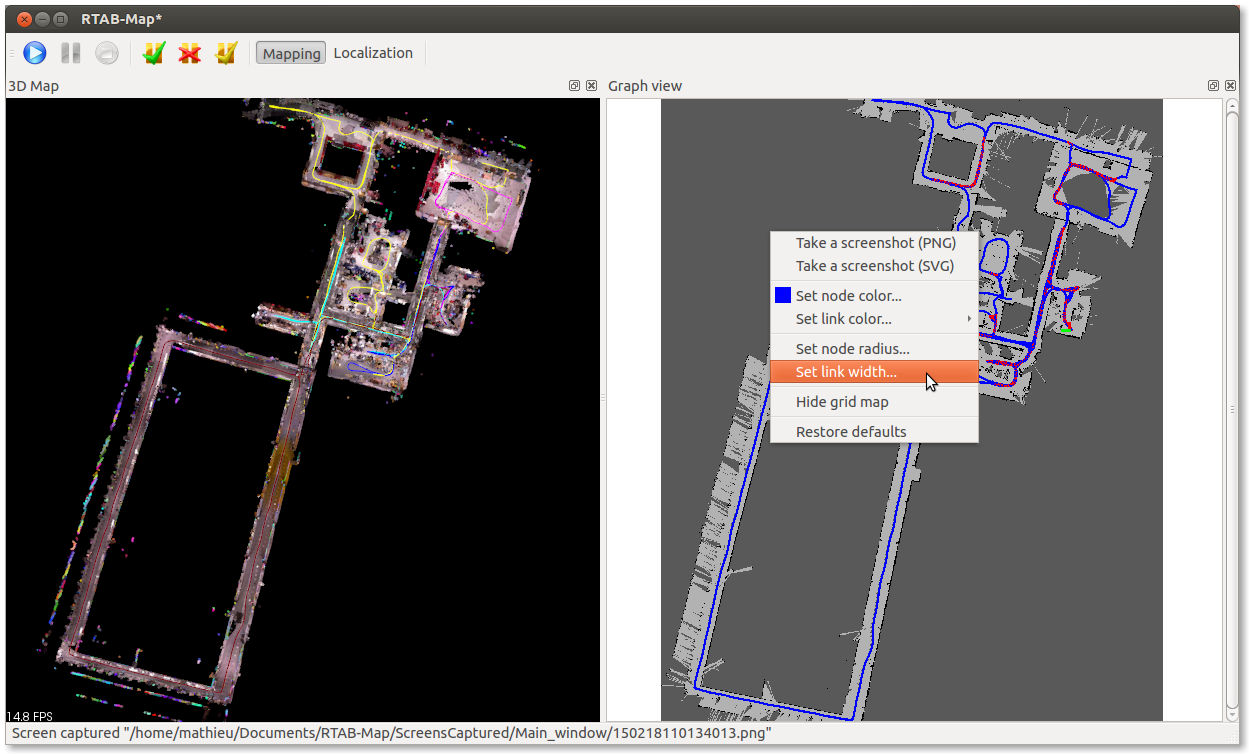
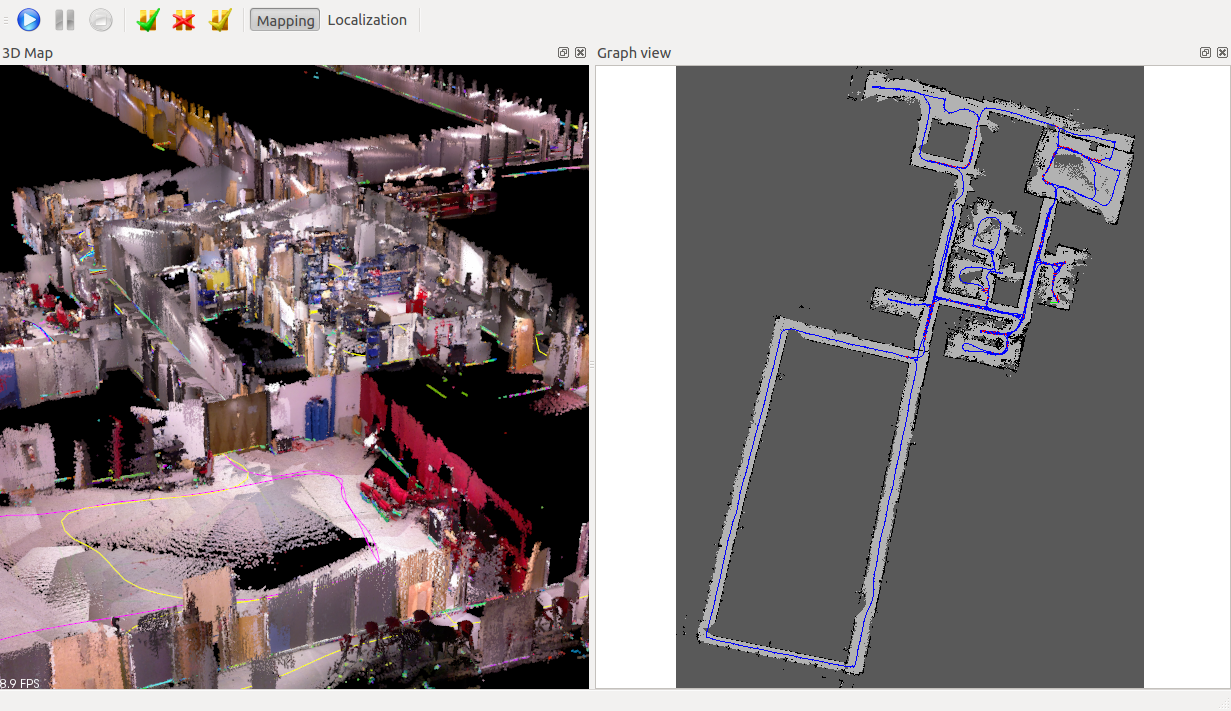
You should see the trajectory in both views. In the 3D map, the trajectory's color indicates a different mapping session. On the Graph view, you can set the line width for better exporting like in the paper. The grey map is created because there are laser scans saved in the database. If you don't have laser scans saved, you can show the projection map of the cloud on the ground like in the second image (see parameter "Occupancy from 3D cloud projection on the ground..."). To adjust the resolution of the grey map created, you can set the parameter "Resolution (cell size)" (one pixel/cell).

Last notes:

  • For the problem when saving the graph, I opened an issue.
  • Data recording doesn't save odometry, only the data. If you do a normal mapping, the odometry will be saved.

Occupancy grid map from laser scans (laser scans required):

Occupancy grid map from 3D cloud projection on the ground (no laser scans required):

Parameters used above:

Reply | Threaded
Open this post in threaded view
|

Re: Trajectory Generation

James
Thanks mr. Labbé,

When I turned the option "Occupancy grid map from laser scans (laser scans required)" on it solved the problem with the absence of the gray map just as you said.

The problem when saving the graph was also solved when I turned the above option on. Only the resolution of the 2D map was a litle bit low.=, but I beleive that it has to do with the parameter "Resolution (cell size)" (one pixel/cell). I set it as the default value 0,05 but I think it was not enought.

Do you know any way to see through the RTAB DatabaseViewer the 2d or 3d map again WITH the trajectory?

Thanks,
Reply | Threaded
Open this post in threaded view
|

Re: Trajectory Generation

matlabbe
Administrator
Hi James,

The resolution of the 3D map is defined by 1 pixel / grid cell. So with the default cell size 0.05 m, there is 1 pixel for each 5 cm cell. A map of 4m/4m would be 80/80 pixels. By setting the resolution to 0.01, the same map would be 400/400 pixels.

In the DatabaseViewer, there is a similar Graph view panel which shows the 2D graph with the grid map (if there are laser scans in the database). However, the option "Occupancy grid map from 3D cloud projection" is not implemented in this application. For the 3D map, only the clouds are exported/viewed without trajectory. Note that almost all options in DatabaseViewer can be found in RTAB-Map standalone (as well 2d or 3d maps with trajectories).

Regards
Reply | Threaded
Open this post in threaded view
|

Re: Trajectory Generation

James
Hi again. One last question:

You said "Note that almost all options in DatabaseViewer can be found in RTAB-Map standalone (as well 2d or 3d maps with trajectories)". Can I, even after closing the database, use the RTAB-Map standalone to see the map? Because I am having trouble doing it. The map from the open database does note show the stored map. What I can do, is manipulate it just after the map have built. But if I close RTAB and open againg opening the recorded database It doesn't show anymore. Is that correct or am I doing something wrong?

Thank you very much! :)
Reply | Threaded
Open this post in threaded view
|

Re: Trajectory Generation

James
Nevermind my last question. I've got it! :)

Thanks! :D
Reply | Threaded
Open this post in threaded view
|

Re: Trajectory Generation

m.omar82
In reply to this post by André
Dear friends
How can I get the background image, the floor design?

I like to make a comparative study between the visual feature (SURF, SIFT etc), how can compare these map?

THANKS for your support
Reply | Threaded
Open this post in threaded view
|

Re: Trajectory Generation

matlabbe
Administrator
Here is the GIMP file: https://www.dropbox.com/s/cnq88noqksk9kby/mixed.xcf?dl=0, the lower layer is the plan (it should be already correctly scaled for grids 1 pix=5 cm).

cheers
Reply | Threaded
Open this post in threaded view
|

Re: Trajectory Generation

m.omar82
THAKS
Reply | Threaded
Open this post in threaded view
|

Re: Trajectory Generation

m.omar82
In reply to this post by matlabbe
Dear Sir
How can print and save the trajectory "robot path" to get figure as you show with multi-sessions mapping.

from File-> Export 2D grid map (*.png) : this show me the map without the path.
I export the poses for (RGBD and KITTI)

any suggestion
Reply | Threaded
Open this post in threaded view
|

Re: Trajectory Generation

matlabbe
Administrator
Hi,

Use right-click on the graph view and "Take a screenshot":


Note that I just fixed a bug with the wrong resulting scale (that bug was introduced past October by this commit). You can also save in SVG (vector image) and the line width can be also modified using the right-click menu.

cheers,
Mathieu
Reply | Threaded
Open this post in threaded view
|

Re: Trajectory Generation

m.omar82
In reply to this post by André
Dear Mathieu

in rtabmap how the loop closure detection effect on the trajectory planner "the node poses "?
is the node poses effect by the loop closure, and how it update?


Thanks for your support
Mohammed
Reply | Threaded
Open this post in threaded view
|

Re: Trajectory Generation

matlabbe
Administrator
Hi,

"the node poses" is coming from where exactly? Loop closures optimize the graph, so yes each pose of the graph will be moved on correction. If you are using planning capability of rtabmap, the current goal will be re-sent to move_base with the corrected position.

cheers,
Mathieu