How to process RGBD-SLAM datasets with RTAB-Map?


Administrator
|
This post was updated on .
(see posts below, moved here for convenience...)
|
|
|
Hi Mr. Labbe,
I am using turtlebot 2 with rtabmap version ros generation of maps as well as it coordinates for location, as others have said the RTAB generates the graph contains position of each nodes in the map, but I would like to apply a groundthruth for comparison the trajectory done, I conducted a survey of some groundtruth systems on the Internet and found the: http://vision.in.tum.de/data/datasets/rgbd-dataset one groundtruth system apparently well prepared with some datasets but for my lack of experience do not understand how I can apply it using the RTABMAP which for me is the best mapping and lozalização 3D system so far, I would like if possible would help me understand how I can do these tests and apply this groundtruth with RTAB if you need additional cameras to observe the robot will not only need to issue some clarification if it is possible to make such an application and which dataset should I use and how to use thank you for the help you will give me and the wonderful system available to the community! !! I believe that this assessment will be very good for the RTAB too. Att, |
|
Administrator
|
This post was updated on .
Hi Antony,
The ground truths of the RGB-D datasets were taken using an external motion capture system (e.g., MotionAnalysis or VICON). Unless you have a motion capture system, it may be difficult to create a ground truth indoor. If you want to test RTAB-Map with the hand-held RGB-D datasets, you can do it with the standalone version and the tgz archives (following example with rgbd_dataset_freiburg3_long_office_household.tgz).
Start mapping and when the processing is finished (and stopped), you can export the poses in RGB-D dataset format with the menu Edit->Advanced->Export poses... -> RGB-D SLAM format. With the exported txt file, you can compare it with the ground truth online here. Note that default RTAB-Map's parameters may not work well for some datasets where the camera is moving fast like the freiburg1_360 dataset. Using optical flow odometry strategy may reduce the chance of getting lost in this particular dataset. The freiburg3_long_office_household works well, and I've tested it using the ROS bag too with rgbdslam_datasets.launch. For the robot SLAM datasets, which have odometry and laser scans from the robot, this could be done with the ROS package and using the ROS bags... but I didn't give a try yet. cheers,Mathieu |
|
|
Hi Mr. Labbe,
Already I want agredecer the previous answer, so for me get to use http://vision.in.tum.de/data/datasets/rgbd-dataset ie the datasets I can do this using the standalone version of rtabmap that ? Would be as follows I lower the dataset for example freiburg3_long_office_household and mind him for the Open Preferences-> Source, select RGB-D the source type, if I'm right at the end of this process I can do the mapping environment I want and could care the coordinates and paths made by both rtabmap and by comparison with the chosen dataset? because I wanted this data comparison and groundthruth to generate some sample paths charts a plan showing the trajectory of rtabmap compared with ground data truth I have some examples of these comparisons with the algorithms but RGBD really want to accomplish with rtabmap to know the quality of their work as it is magnificent. I and new with respect to testing and comparison to the systems so groundthruth questions. I hope you have understood my doubts and thank you for answering them Cheers, Antony |
|
Administrator
|
Hi,
As explained in my previous post, you can process the rgbd datasets using the standalone version of rtabmap. For example, if I download rgbd_dataset_freiburg3_long_office_household.tgz and process this dataset as the instructions of the previous post (note that I have updated the instructions!), I have this final result in the 3D Map view: 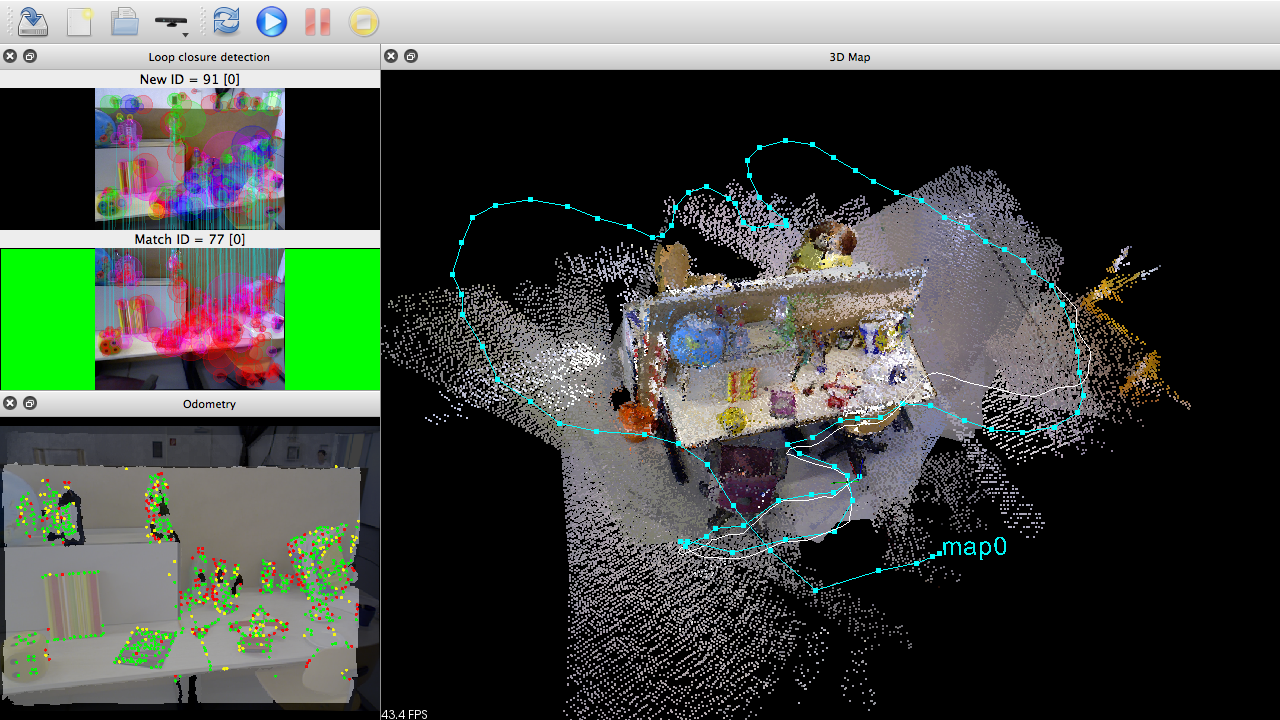 Exporting the poses in RGBD-SLAM format, I have (note that I activated "Ignore covariance" for graph optimization in Preferences->RGBD-SLAM panel, which gave a better result): 1341847980.722988 0.000000 0.000000 0.000000 1.000000 0.000000 0.000000 0.000000 1341847981.626675 -0.015642 0.061187 -0.000442 0.999929 0.006101 -0.004540 -0.009154 1341847982.630723 -0.035538 0.181744 0.004040 0.999537 0.012725 -0.000731 -0.027633 1341847983.534806 -0.012084 0.434090 0.006632 0.998020 0.022177 0.006554 -0.058493 1341847984.574807 0.039428 0.819880 -0.050540 0.996115 0.032080 0.015546 -0.080520 1341847985.514673 0.357964 0.996485 0.078933 0.991189 0.057660 0.005558 -0.119119 1341847986.425858 0.659426 1.135171 0.262795 0.974064 0.101676 -0.020838 -0.201066 1341847987.490754 1.013584 1.198761 0.390101 0.944529 0.138165 -0.013260 -0.297657 1341847988.469742 1.293537 1.325266 0.426767 0.925981 0.168579 -0.033202 -0.336210 1341847989.402777 1.380018 1.527537 0.499062 0.918713 0.173919 -0.017765 -0.354124 1341847990.374663 1.404609 1.829323 0.578755 0.910131 0.172092 -0.021914 -0.376253 1341847991.310807 1.491128 2.045545 0.641578 0.885992 0.207763 -0.023325 -0.413895 1341847992.318683 1.637897 2.195412 0.765970 0.834651 0.253896 -0.018423 -0.488421 1341847993.222703 1.829369 2.371635 0.874583 0.797212 0.281073 -0.012885 -0.534121 1341847994.233618 2.091439 2.436369 1.031331 0.749945 0.308184 -0.012674 -0.585187 1341847995.266776 2.360920 2.535637 1.189336 0.683120 0.344682 -0.018680 -0.643577 1341847996.239003 2.534574 2.524890 1.279359 0.634688 0.367216 -0.021810 -0.679593 1341847997.210888 2.753426 2.574844 1.380139 0.585203 0.385795 -0.024802 -0.712801 1341847998.154051 2.995849 2.481680 1.549125 0.541851 0.388985 -0.039163 -0.744012 1341847999.086763 3.298964 2.385295 1.678156 0.549242 0.399500 -0.008962 -0.733930 1341848000.094780 3.455787 2.208325 1.730280 -0.419460 -0.443787 0.044518 0.790648 1341848001.030740 3.489796 1.941671 1.750445 -0.320499 -0.471950 0.044436 0.820103 1341848002.070767 3.456978 1.659756 1.682983 -0.171105 -0.473491 0.033400 0.863374 1341848003.042638 3.401794 1.431796 1.573186 -0.129961 -0.492400 0.021199 0.860350 1341848004.053778 3.373706 1.185682 1.486023 -0.245042 -0.459789 -0.009661 0.853496 1341848004.993849 3.337674 0.996765 1.379758 -0.363041 -0.471999 -0.038799 0.802442 1341848005.965681 3.383622 0.899234 1.382972 -0.460351 -0.446871 -0.041707 0.765927 1341848006.937738 3.463827 0.795706 1.443390 0.506704 0.413948 0.006119 -0.756215 1341848007.866745 3.615875 0.718124 1.577369 -0.419052 -0.441864 0.018843 0.792967 1341848008.806865 3.728293 0.562477 1.681484 -0.301363 -0.489901 0.037806 0.817158 1341848009.846800 3.815309 0.362520 1.706377 -0.196345 -0.509786 0.023237 0.837274 1341848010.782711 3.648448 0.202933 1.616570 -0.139902 -0.533313 0.026125 0.833860 1341848011.722610 3.562402 0.164542 1.580802 -0.045360 -0.543805 0.032270 0.837364 1341848012.726854 3.388871 0.150175 1.429914 -0.063930 -0.572725 -0.008428 0.817208 1341848013.634812 3.380094 0.052813 1.370923 -0.242790 -0.556426 -0.057955 0.792517 1341848014.670828 3.463327 -0.156204 1.368270 -0.470749 -0.471990 -0.093638 0.739495 1341848015.650094 3.500472 -0.326812 1.346064 0.651140 0.429360 0.095384 -0.618521 1341848016.554210 3.523529 -0.327644 1.385468 0.718242 0.373655 0.071169 -0.582619 1341848017.587838 3.624275 -0.202518 1.506016 0.656631 0.395258 0.030286 -0.641630 1341848018.534507 3.720940 -0.133993 1.585047 0.574151 0.419994 -0.001922 -0.702817 1341848019.567087 3.972068 -0.116129 1.759334 -0.469802 -0.438678 -0.000072 0.766060 1341848020.502691 4.158896 -0.163116 1.882137 -0.342151 -0.452616 0.011016 0.823377 1341848021.455728 4.298509 -0.344734 1.980489 -0.208649 -0.463711 0.028765 0.860587 1341848022.454164 4.320905 -0.641646 2.034866 -0.063492 -0.443971 0.027644 0.893361 1341848023.386908 4.210284 -0.900535 1.992962 0.136919 -0.479334 0.003605 0.866879 1341848024.390878 3.991068 -1.038592 1.882018 0.281935 -0.476360 0.020229 0.832577 1341848025.330653 3.845056 -1.225899 1.761826 0.387461 -0.474673 0.033593 0.789577 1341848026.267001 3.711481 -1.363885 1.662458 0.466353 -0.462705 0.053294 0.752050 1341848027.238696 3.567385 -1.556652 1.561285 0.508584 -0.450143 0.053609 0.732010 1341848028.186050 3.396239 -1.759830 1.497405 0.485296 -0.439509 0.036065 0.754996 1341848029.320225 3.124560 -1.881982 1.363677 0.505739 -0.440161 0.036903 0.741030 1341848030.258930 2.978769 -2.066120 1.274819 0.581008 -0.418855 0.042052 0.696578 1341848031.162860 2.796127 -2.168044 1.160962 0.659951 -0.366817 0.061540 0.652781 1341848032.098732 2.640893 -2.285500 1.101617 0.716377 -0.335842 0.050630 0.609468 1341848033.006687 2.476127 -2.396729 1.024169 0.735826 -0.317286 0.038242 0.597016 1341848033.911229 2.313375 -2.404948 0.939631 0.776684 -0.285819 0.045964 0.559426 1341848034.882707 2.143871 -2.499783 0.849634 0.828643 -0.244587 0.034748 0.502316 1341848036.022779 1.937980 -2.471042 0.724471 0.863958 -0.193496 0.057134 0.461379 1341848037.026790 1.693402 -2.400076 0.606670 0.896477 -0.157978 0.033005 0.412652 1341848038.066849 1.448825 -2.280089 0.463199 0.911500 -0.142362 0.003790 0.385857 1341848038.970765 1.263068 -2.150882 0.349865 0.931212 -0.126046 -0.005993 0.341936 1341848039.881803 1.075267 -2.055720 0.231431 0.949525 -0.116600 -0.014149 0.290872 1341848040.814675 0.937568 -1.879959 0.169327 0.974551 -0.067642 -0.013210 0.213306 1341848041.886710 0.902419 -1.627144 0.107878 0.994595 0.006987 0.009388 0.103171 1341848042.897767 0.947701 -1.345008 0.099697 0.996148 0.085868 0.016921 -0.005415 1341848043.805817 1.035646 -1.113247 0.126924 0.988234 0.133583 0.020118 -0.071728 1341848044.771011 1.182606 -0.945075 0.179481 0.971949 0.189597 0.018270 -0.137962 1341848045.842865 1.391817 -0.747169 0.256959 0.969646 0.193325 0.020685 -0.148269 1341848046.778736 1.498058 -0.554503 0.263352 0.986995 0.131049 0.028476 -0.088640 1341848047.750845 1.410600 -0.306955 0.236273 0.992047 0.110925 0.034259 -0.048619 1341848048.690791 1.377580 -0.085028 0.281068 0.990562 0.113718 0.011745 -0.075618 1341848049.562799 1.300152 0.101365 0.341824 0.991556 0.102349 -0.019408 -0.077238 1341848050.534849 1.219897 0.362505 0.292995 0.998357 0.053401 -0.015810 -0.013473 1341848051.470890 1.187017 0.572173 0.302556 0.996555 0.002213 -0.047224 0.068141 1341848052.444722 1.118315 0.501245 0.238305 0.984323 -0.124130 -0.060674 0.109632 1341848053.421775 0.963094 0.290268 0.165763 0.991791 -0.106554 -0.068708 0.016644 1341848054.387103 0.802171 0.261264 0.164820 0.995904 0.032304 -0.022616 -0.081359 1341848055.294725 0.595698 0.318826 0.106856 0.985656 0.095665 -0.055927 -0.127293 1341848056.198744 0.431039 0.526133 0.021924 0.972075 0.130626 -0.065316 -0.183687 1341848057.134714 0.470174 0.860036 0.050358 0.977754 0.145796 -0.021488 -0.149263 1341848058.006833 0.507086 1.196903 0.028821 0.962340 0.189907 0.005304 -0.194445 1341848058.978865 0.623851 1.445117 0.107917 0.956953 0.204554 -0.022095 -0.204720 1341848059.882730 0.638233 1.489221 0.111189 0.938194 0.211442 -0.053526 -0.268736 1341848060.823967 0.611327 1.463567 0.081338 0.941651 0.167010 -0.086427 -0.279161 1341848061.762815 0.582749 1.331911 0.137260 0.940475 0.167473 -0.114650 -0.272608 1341848062.666740 0.620577 1.268873 0.154009 0.953611 0.159328 -0.093601 -0.237655 1341848063.541802 0.600509 1.092471 0.135644 0.968231 0.121699 -0.077919 -0.204076 1341848064.481773 0.714159 0.815155 0.178606 0.974191 0.110186 -0.071673 -0.183505 1341848065.446728 0.712172 0.580535 0.161716 0.977982 0.110008 -0.084538 -0.155891 1341848066.418820 0.714043 0.406706 0.114603 0.991285 0.066502 -0.078697 -0.082087 1341848067.491527 0.741824 0.192498 0.175646 0.994099 0.033307 -0.080028 -0.065221 The ground truth can be downloaded at the same place, which is rgbd_dataset_freiburg3_long_office_household-groundtruth.txt. You can't show in RTAB-Map the ground truth if this is what you want to do. However, to compare the trajectories visually, you can use the rgbd-datasets offline scripts or online tool: 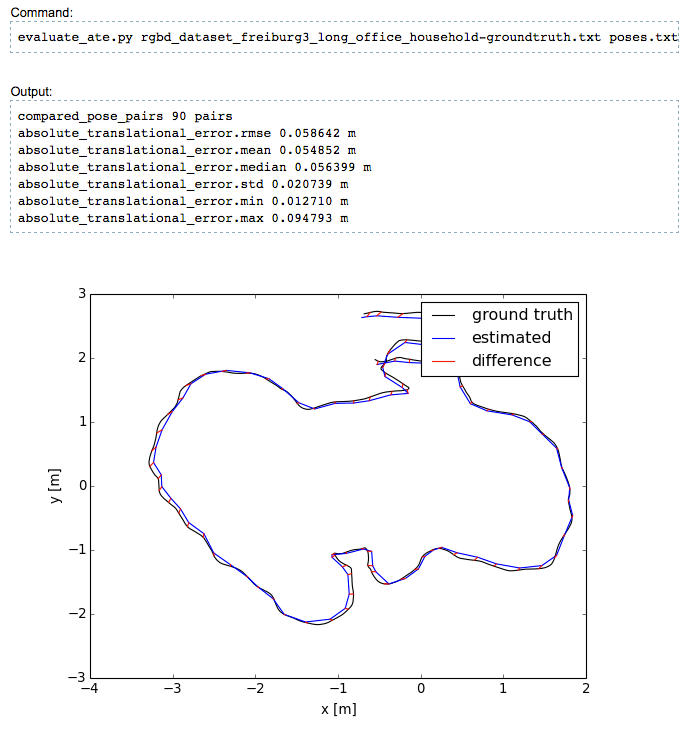 cheers |
|
|
Hello Mr. Labbe
Mr. labbe I was able to ride the benchmark mentioned above and could generate this map shown you in the previous post and this comparison graphic but also to improve my analytical work was wondering if there's some charts to serve as a comparison or showing other important data on Rtabmap and the stand-alone version can be drawn from these graphs or only using tools like this: https://github.com/introlab/rtabmap/wiki/Benchmark thanks in advance for your attention. Att, |
|
|
This post was updated on .
Hello Mr. Labbe
Another Question, What data the statistics would be interesting to show in charts for analyzing the Rtabmap and how export after finish the mapping ?! And i can in the stand alone version export just the trajectory generated??? Thanks |
|
Administrator
|
This post was updated on .
Hi Leo,
To compare with other approaches, you may want to look what they are using as metrics in other papers. The commons metrics I have seen are: 1. Odometry/Localization metrical accuracy (rmse) as with the rgbd-slam datasets above, 2. Loop closure detection precision/recall rate as in the Benchmark page. With the standalone, you can open a previous database, download all clouds or graph, then export the poses (File -> Export poses). If you want to look more deeply to other statistics provided by rtabmap, you can look at the Statistics panel (you can after export shown statistics by right-clicking on the legend item and select "Copy data to clipboard"). cheers |
|
|
Again thank you for your attention Mr. Labbe,
I could withdraw some graphics for the stand-alone version of RTAB-map, but I got questions about the analysis of charts. Below, I show some charts that I found interesting, but I have doubts about what each axle means and with which I can compare (statistical graph as well). 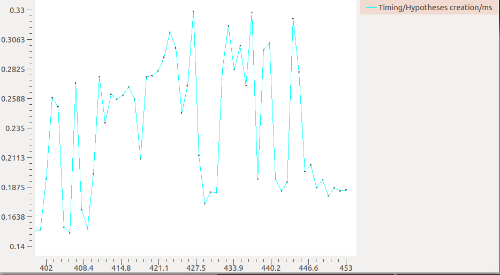 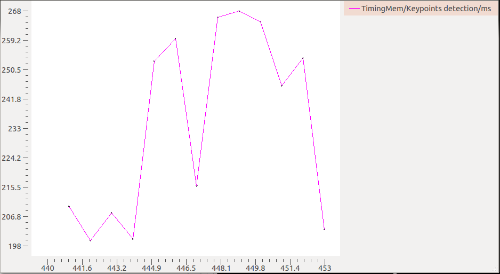 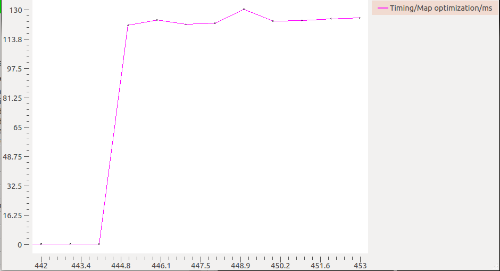 Thanks |
|
Administrator
|
Hi Leo,
The x-axis is the ID of each node added to map's graph. If nodes are added at 1 Hz ("Detection Rate" under RTAB-Map settings panel in Preferences or "Rtabmap/DetectionRate", which is 1 Hz by default), the x-axis would be in seconds (timeSec = ID/DetectionRate). The y-axis units are shown in the Legend item of the curve (after the second '/'), which is in "ms" here: 0.33 ms for hypothesis creation, 268 ms for features detection and 130 ms for graph optimization. Note that you can add more than one curve to the same figure. For the x-axis, you make me think that I could also put an option to use node stamps instead of node IDs. Added an issue here :P cheers, Mathieu |
|
|
In reply to this post by matlabbe
Hello Mr. Mathieu
I'm trying to use the Dataset fr2 / large_no_loop by following the steps outlined above could make use of associate.py scritp with the directory of the dataset, and created a file with similar .yaml data which shows the previous post and put them in Documents folder / RTAB-MAP / put here do not have this third folder that had to make the call camera_info. So far so good my difficulty was at the time of RTAB-MAP preparation to enter the Preferences / source not found the options described, for example, the source type found in source image but have nowhere to put the name of calibration as required, or where to upload the rgb_sync and depth_sync (that when using the script did not find these directories as well). In short I could not identify the options for achieving the steps 3,4, and 5 in the previous post. Using Imagen source menu and uploading just the past rgb within the dataset and give the play the RTAB-map displays the error below: 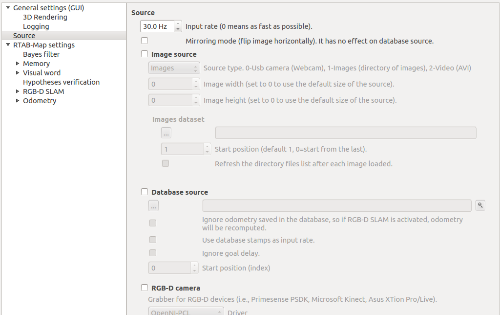  I thank the attention !! |
|
Administrator
|
Hi Marina,
you should use the latest version (at least 0.10). You can download it here: https://github.com/introlab/rtabmap/releases cheers, Mathieu |
|
|
This post was updated on .
Thank you very much Mr. Mathieu,
Now it worked with the settings and mapping starts though, we RED SCREEN all the time, can not be compatible with the dataset? I am using o fr2 / large_no_loop and large_with_loop because the first including by not having the loop closure I understand that should take care of it but the second including loop closure and red screen continue. OBS. I'm using the same .yaml configuration described in Chapter 2 of the previous post. Thank you again. |
|
Administrator
|
Hi Marina,
these datasets are challenging because the depth values are over 3-4 meters very often (Kinect-like sensors have poor depth resolution after 4 meters), so we cannot get a very precise odometry. For the red screens, they happen when there are no enough features to track with good depth values. For example, in the large_no_loop dataset at time 1311875875.131870, we have:  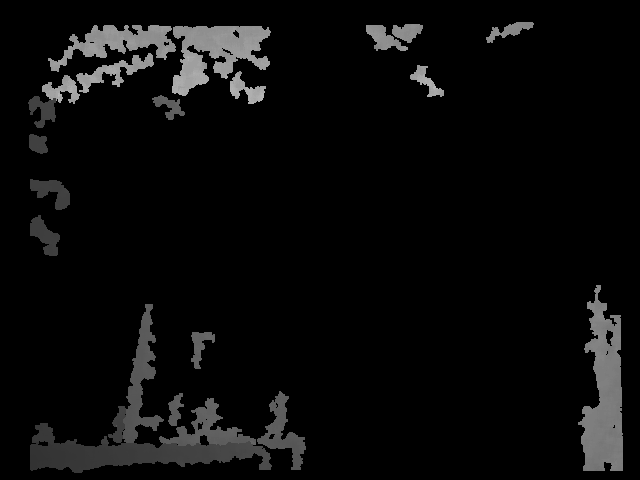 There are almost no valid depth values. You can try to reduce the framerate (to process more images), try Optical Flow odometry or use datasets similar to "rgbd_dataset_freiburg3_long_office_household". When scanning with such sensors (Kinect v1 or Xtion Live Pro), you should avoid situations where objects are over 4 meters or there are no objects at all (empty spaces). More info about RED screens here:https://github.com/introlab/rtabmap/wiki/Kinect-mapping#lostodometry cheers, Mathieu |
|
|
In reply to this post by matlabbe
Hello, I downloaded the dataset and follow all the instructions, but I get this error:
[FATAL] (2016-08-09 15:00:00.077) Odometry.cpp:205::process() Condition (dt>0.0 || (dt == 0.0 && previousVelocityTransform_.isNull())) not met! Idk what it means, any idea? Thanks |
|
Administrator
|
Is this happen on start or after mapping a while? I assume you are on version 0.11.7 as in 0.11.8 there is a little more info on that assert. In this issue they had the same error. What I answered:
You are using the images dataset version, right? not the rosbag? It could be caused by images not correctly sorted when reading the directory of images, so the stamps are not in order (causing a negative "dt" between consecutive images). On which system are you? cheers |
|
|
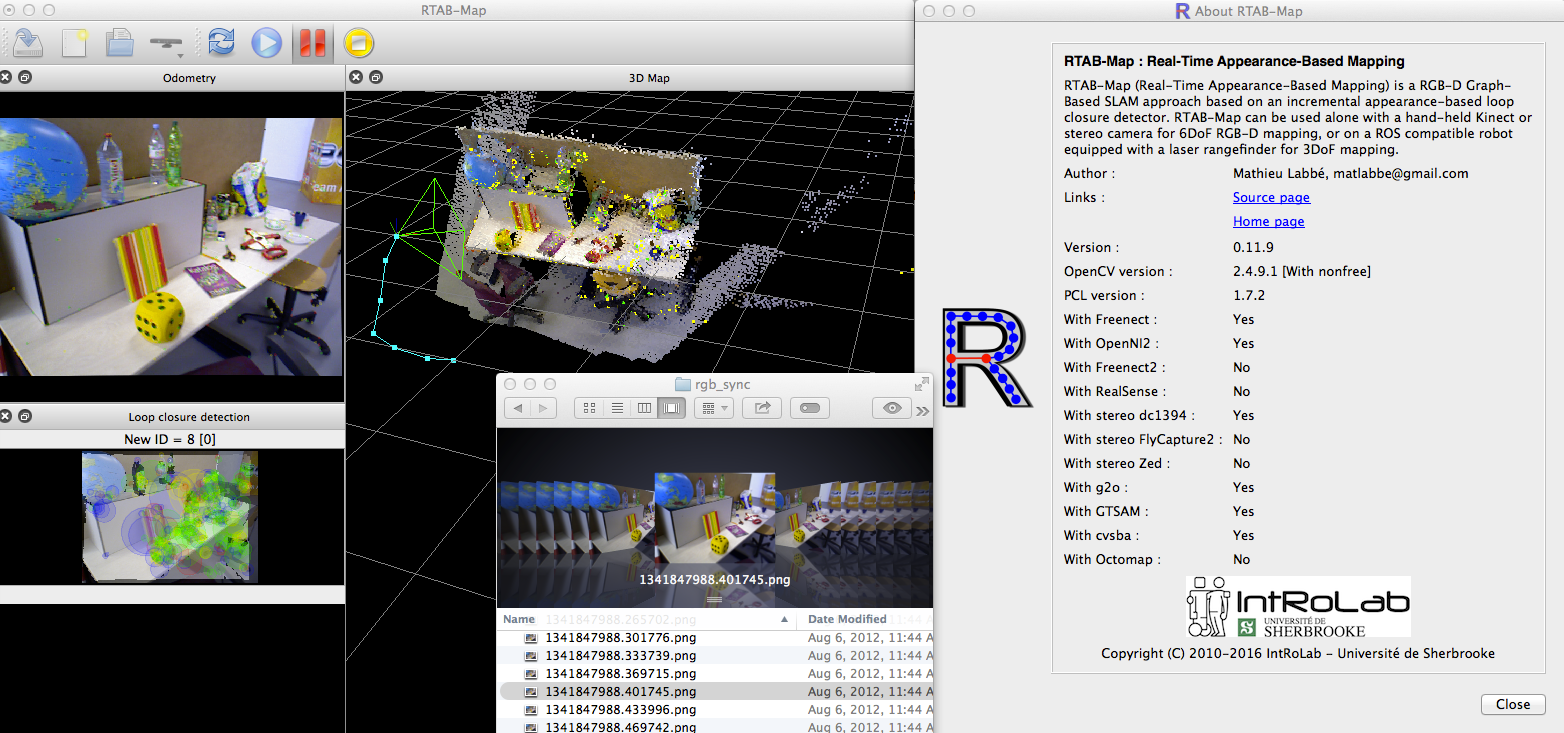
Hello, I understand what you said, so I fixed the problem checking the option "Synchronize capture rate with timestamps" and unchecking the other one "Use file names as timestamps. Format is epoch time. Example: "1305031102.175304.png".
I have a curiosity, when I am doing the mapping, why my images are in gray scale? I saw your screenshot previously in this thread, and your images and map are in color. Look, my 3D map has no color.  |
|
Administrator
|
You images in RGB directory, are they in color?
|
|
|
Yes, are the downloaded images from rgbd_dataset_freiburg3_long_office_household.tgz.
|
|
Administrator
|
I was testing the same dataset, on which system are you testing? Maybe there is a difference between OpenCV2 and OpenCV3 (cv::imread() method may not work identically).
|
| Free forum by Nabble | Edit this page |